| Red | Green | Blue | |
| z | 17.64 | ||
| znorm | Inf | ||
| sky | -Inf | -Inf | -Inf |
| S/N | 26.7 | 46.8 | 49.7 |
| S/N(c) | 0.0 | 0.0 | 0.0 |
| SN(E/C) |

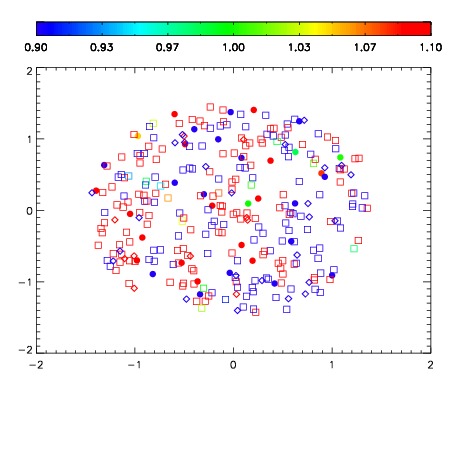


| Frame | Nreads | Zeropoints | Mag plots | Spatial mag deviation | Spatial sky 16325A emission deviations (filled: sky, open: star) | Spatial sky continuum emission | Spatial sky telluric CO2 absorption deviations (filled: H < 10) | |||||||||||||||||||||||
| 0 | 0 |
|
|
|
|
|
|
| IPAIR | NAME | SHIFT | NEWSHIFT | S/N | NAME | SHIFT | NEWSHIFT | S/N |
| 0 | 03980061 | 0.499038 | 0.00000 | 19.0555 | 03980060 | -0.000882196 | 0.499920 | 19.0701 |
| 1 | 03980058 | 0.497079 | 0.00195900 | 19.0587 | 03980059 | -0.00109439 | 0.500132 | 19.1069 |
| 2 | 03980057 | 0.497009 | 0.00202900 | 19.0336 | 03980056 | 0.00000 | 0.499038 | 18.9411 |
| 3 | 03980062 | 0.498734 | 0.000304013 | 18.8659 | 03980063 | 0.000257340 | 0.498781 | 18.9036 |