| Red | Green | Blue | |
| z | 17.64 | ||
| znorm | Inf | ||
| sky | -Inf | -Inf | -Inf |
| S/N | 21.6 | 36.1 | 39.6 |
| S/N(c) | 0.0 | 0.0 | 0.0 |
| SN(E/C) |


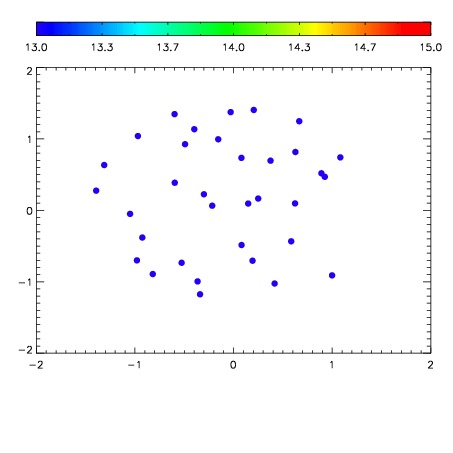

| Frame | Nreads | Zeropoints | Mag plots | Spatial mag deviation | Spatial sky 16325A emission deviations (filled: sky, open: star) | Spatial sky continuum emission | Spatial sky telluric CO2 absorption deviations (filled: H < 10) | |||||||||||||||||||||||
| 0 | 0 |
|
|
|
|
|
|
| IPAIR | NAME | SHIFT | NEWSHIFT | S/N | NAME | SHIFT | NEWSHIFT | S/N |
| 0 | 04600031 | 0.498158 | 0.00000 | 18.6533 | 04600032 | 0.00495383 | 0.493204 | 18.5645 |
| 1 | 04600026 | 0.495502 | 0.00265601 | 19.0719 | 04600025 | 0.00000 | 0.498158 | 18.9311 |
| 2 | 04600027 | 0.496410 | 0.00174800 | 19.0365 | 04600028 | 0.00256752 | 0.495590 | 18.8412 |
| 3 | 04600030 | 0.496275 | 0.00188300 | 18.4090 | 04600029 | 0.00508826 | 0.493070 | 18.4473 |