| Red | Green | Blue | |
| z | 17.64 | ||
| znorm | Inf | ||
| sky | -NaN | -NaN | -Inf |
| S/N | 31.4 | 54.4 | 59.5 |
| S/N(c) | 0.0 | 0.0 | 0.0 |
| SN(E/C) |
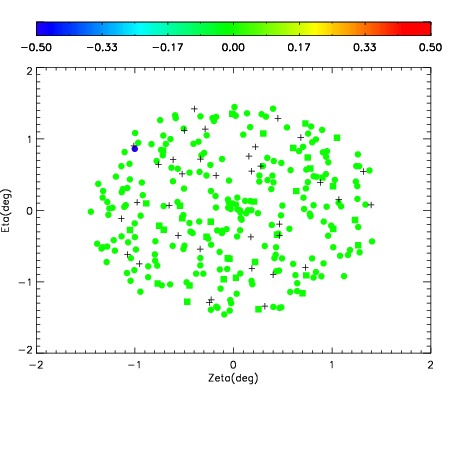
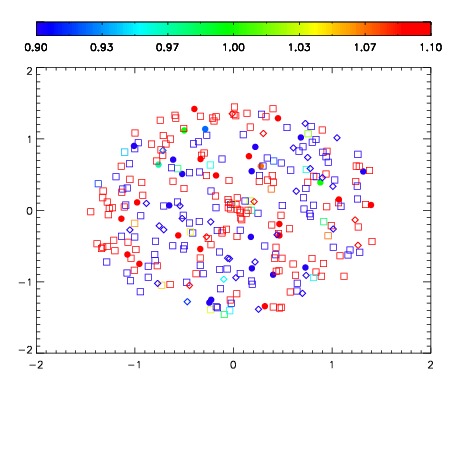
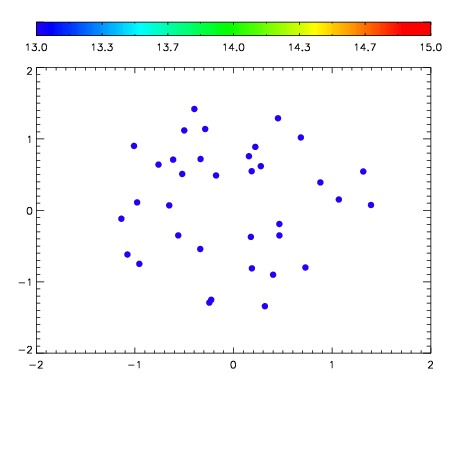

| Frame | Nreads | Zeropoints | Mag plots | Spatial mag deviation | Spatial sky 16325A emission deviations (filled: sky, open: star) | Spatial sky continuum emission | Spatial sky telluric CO2 absorption deviations (filled: H < 10) | |||||||||||||||||||||||
| 0 | 0 |
|
|
|
|
|
|
| IPAIR | NAME | SHIFT | NEWSHIFT | S/N | NAME | SHIFT | NEWSHIFT | S/N |
| 0 | 03420071 | 0.504282 | 0.00000 | 19.1705 | 03420072 | 0.00302837 | 0.501254 | 19.1664 |
| 1 | 03420074 | 0.501808 | 0.00247401 | 19.2580 | 03420076 | 0.00636859 | 0.497913 | 19.2509 |
| 2 | 03420075 | 0.503669 | 0.000612974 | 19.2466 | 03420073 | 0.00400760 | 0.500274 | 19.2358 |
| 3 | 03420070 | 0.501320 | 0.00296199 | 19.1694 | 03420069 | 0.00000 | 0.504282 | 19.1583 |