| Red | Green | Blue | |
| z | 17.63 | ||
| znorm | Inf | ||
| sky | -Inf | -NaN | -Inf |
| S/N | 23.6 | 42.9 | 45.9 |
| S/N(c) | 0.0 | 0.0 | 0.0 |
| SN(E/C) |
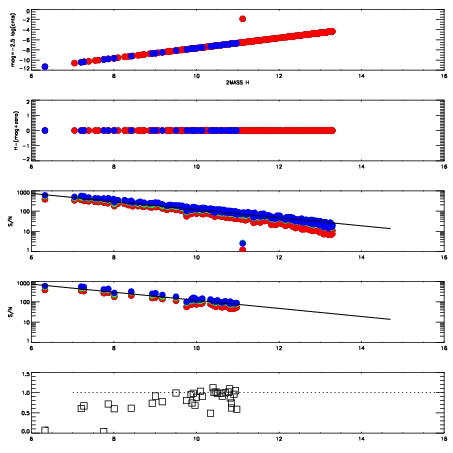
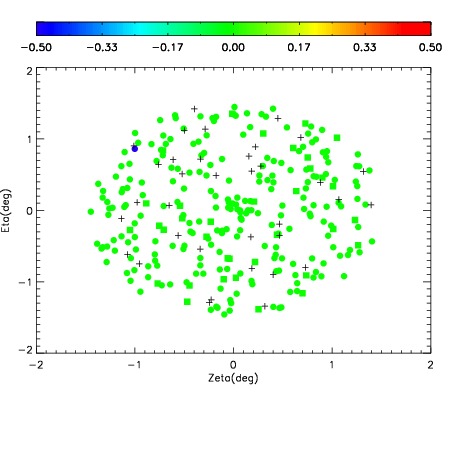
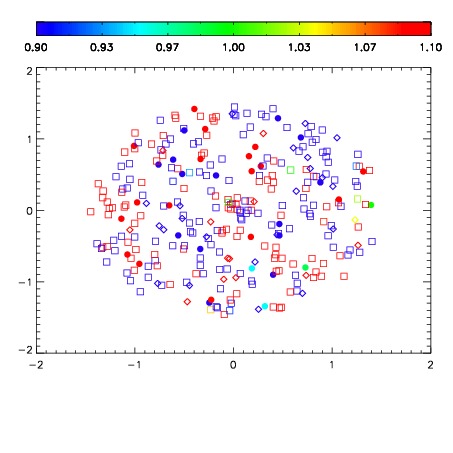
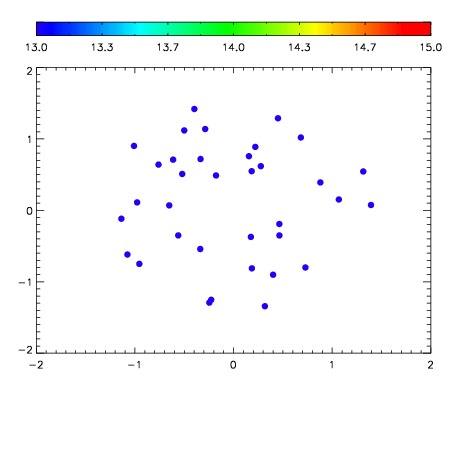

| Frame | Nreads | Zeropoints | Mag plots | Spatial mag deviation | Spatial sky 16325A emission deviations (filled: sky, open: star) | Spatial sky continuum emission | Spatial sky telluric CO2 absorption deviations (filled: H < 10) | |||||||||||||||||||||||
| 0 | 0 |
|
|
|
|
|
|
| IPAIR | NAME | SHIFT | NEWSHIFT | S/N | NAME | SHIFT | NEWSHIFT | S/N |
| 0 | 03490012 | 0.507215 | 0.00000 | 18.8381 | 03490017 | 0.00257339 | 0.504642 | 18.8121 |
| 1 | 03490015 | 0.505425 | 0.00179005 | 19.0244 | 03490014 | 0.000640055 | 0.506575 | 18.9662 |
| 2 | 03490016 | 0.506496 | 0.000719011 | 19.0139 | 03490013 | 0.000169739 | 0.507045 | 18.9450 |
| 3 | 03490011 | 0.505539 | 0.00167602 | 18.7743 | 03490010 | 0.00000 | 0.507215 | 18.8111 |