| Red | Green | Blue | |
| z | 17.64 | ||
| znorm | Inf | ||
| sky | -Inf | -Inf | -Inf |
| S/N | 9.8 | 18.8 | 20.5 |
| S/N(c) | 0.0 | 0.0 | 0.0 |
| SN(E/C) |

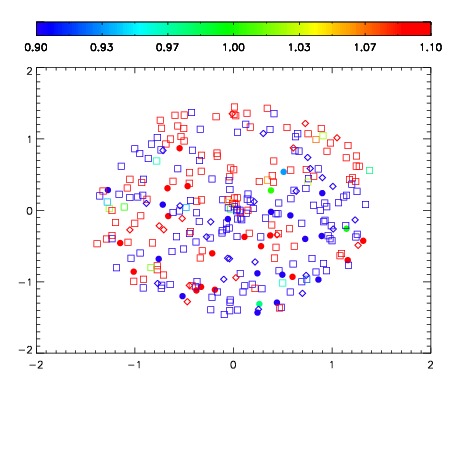


| Frame | Nreads | Zeropoints | Mag plots | Spatial mag deviation | Spatial sky 16325A emission deviations (filled: sky, open: star) | Spatial sky continuum emission | Spatial sky telluric CO2 absorption deviations (filled: H < 10) | |||||||||||||||||||||||
| 0 | 0 |
|
|
|
|
|
|
| IPAIR | NAME | SHIFT | NEWSHIFT | S/N | NAME | SHIFT | NEWSHIFT | S/N |
| 0 | 03140097 | 0.507964 | 0.00000 | 17.3727 | 03140098 | 0.00218016 | 0.505784 | 17.3767 |
| 1 | 03140101 | 0.503101 | 0.00486302 | 17.8393 | 03140102 | -0.00151545 | 0.509479 | 18.1672 |
| 2 | 03140100 | 0.499595 | 0.00836903 | 17.6983 | 03140099 | -0.00281804 | 0.510782 | 17.8885 |
| 3 | 03140096 | 0.506935 | 0.00102901 | 17.6208 | 03140095 | 0.00000 | 0.507964 | 17.8300 |