| Red | Green | Blue | |
| z | 17.64 | ||
| znorm | Inf | ||
| sky | -Inf | -NaN | -Inf |
| S/N | 30.0 | 52.3 | 55.5 |
| S/N(c) | 0.0 | 0.0 | 0.0 |
| SN(E/C) |
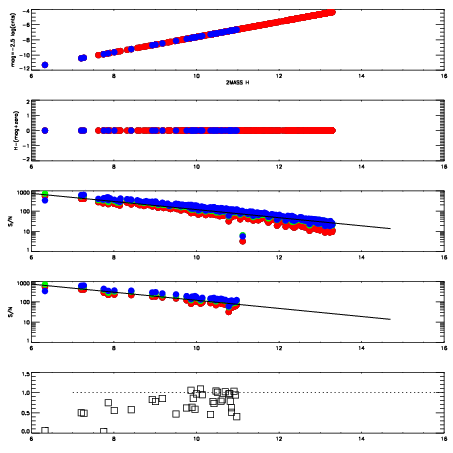
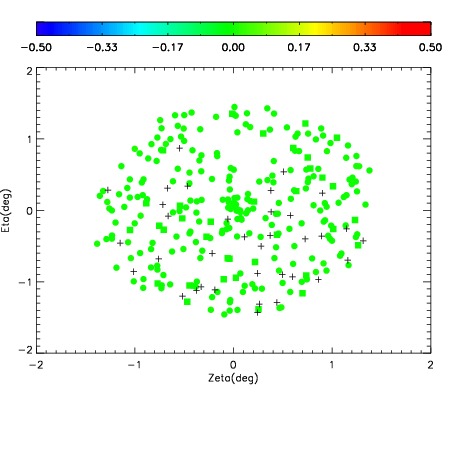
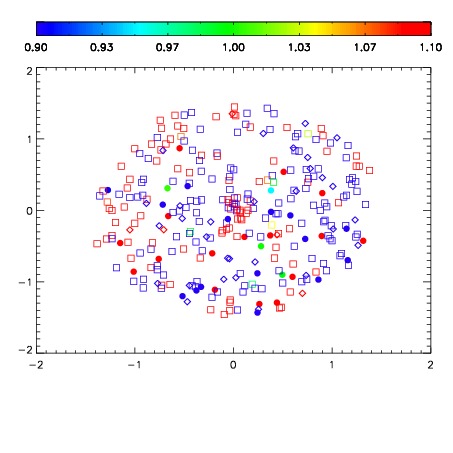
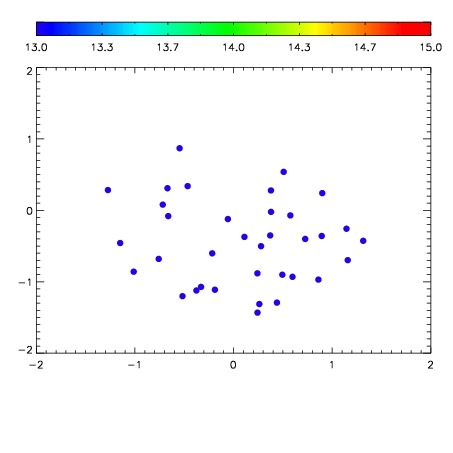

| Frame | Nreads | Zeropoints | Mag plots | Spatial mag deviation | Spatial sky 16325A emission deviations (filled: sky, open: star) | Spatial sky continuum emission | Spatial sky telluric CO2 absorption deviations (filled: H < 10) | |||||||||||||||||||||||
| 0 | 0 |
|
|
|
|
|
|
| IPAIR | NAME | SHIFT | NEWSHIFT | S/N | NAME | SHIFT | NEWSHIFT | S/N |
| 0 | 03660063 | 0.498447 | 0.00000 | 19.1794 | 03660065 | 0.000823586 | 0.497623 | 19.1014 |
| 1 | 03660067 | 0.498353 | 9.39965e-05 | 19.2233 | 03660068 | 0.00172829 | 0.496719 | 19.2326 |
| 2 | 03660062 | 0.496439 | 0.00200799 | 19.2010 | 03660064 | 0.00194123 | 0.496506 | 19.1976 |
| 3 | 03660066 | 0.496254 | 0.00219300 | 19.1806 | 03660061 | 0.00000 | 0.498447 | 19.1218 |