| Red | Green | Blue | |
| z | 17.64 | ||
| znorm | Inf | ||
| sky | -Inf | -Inf | -Inf |
| S/N | 20.6 | 38.7 | 40.9 |
| S/N(c) | 0.0 | 0.0 | 0.0 |
| SN(E/C) |
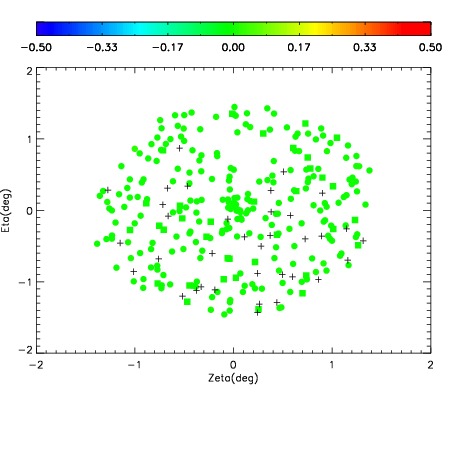
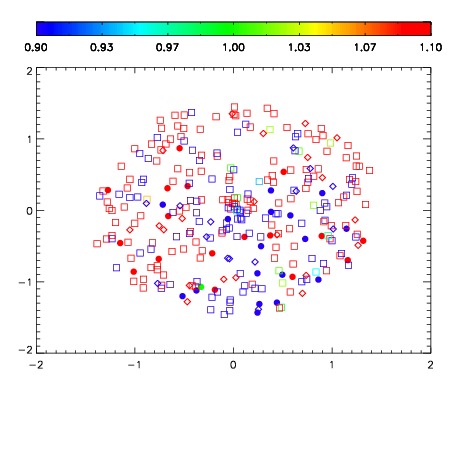


| Frame | Nreads | Zeropoints | Mag plots | Spatial mag deviation | Spatial sky 16325A emission deviations (filled: sky, open: star) | Spatial sky continuum emission | Spatial sky telluric CO2 absorption deviations (filled: H < 10) | |||||||||||||||||||||||
| 0 | 0 |
|
|
|
|
|
|
| IPAIR | NAME | SHIFT | NEWSHIFT | S/N | NAME | SHIFT | NEWSHIFT | S/N |
| 0 | 03760068 | 0.512539 | 0.00000 | 18.5911 | 03760069 | 0.000928655 | 0.511610 | 18.6805 |
| 1 | 03760067 | 0.512226 | 0.000313044 | 18.4807 | 03760066 | 0.00114907 | 0.511390 | 18.4432 |
| 2 | 03760072 | 0.511633 | 0.000906050 | 18.4578 | 03760073 | -0.000315601 | 0.512855 | 18.4155 |
| 3 | 03760071 | 0.511000 | 0.00153905 | 18.4054 | 03760065 | 0.000542483 | 0.511997 | 18.3704 |
| 4 | 03760063 | 0.509889 | 0.00265002 | 18.1622 | 03760062 | 0.00000 | 0.512539 | 18.1523 |
| 5 | 03760064 | 0.510829 | 0.00171006 | 17.7719 | 03760070 | -0.000146858 | 0.512686 | 18.0170 |