| Red | Green | Blue | |
| z | 17.64 | ||
| znorm | Inf | ||
| sky | -Inf | -Inf | -Inf |
| S/N | 17.7 | 32.3 | 32.8 |
| S/N(c) | 0.0 | 0.0 | 0.0 |
| SN(E/C) |

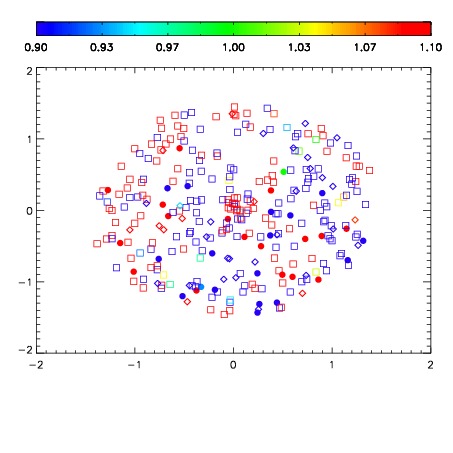


| Frame | Nreads | Zeropoints | Mag plots | Spatial mag deviation | Spatial sky 16325A emission deviations (filled: sky, open: star) | Spatial sky continuum emission | Spatial sky telluric CO2 absorption deviations (filled: H < 10) | |||||||||||||||||||||||
| 0 | 0 |
|
|
|
|
|
|
| IPAIR | NAME | SHIFT | NEWSHIFT | S/N | NAME | SHIFT | NEWSHIFT | S/N |
| 0 | 03960041 | 0.489323 | 0.00000 | 16.0330 | 03960042 | 0.000484320 | 0.488839 | 17.1246 |
| 1 | 03960044 | 0.487673 | 0.00164998 | 18.8819 | 03960046 | -0.00268200 | 0.492005 | 18.8316 |
| 2 | 03960045 | 0.488645 | 0.000678003 | 18.8142 | 03960039 | 0.00000 | 0.489323 | 18.3922 |
| 3 | 03960040 | 0.488883 | 0.000440001 | 17.4347 | 03960043 | -0.00204541 | 0.491368 | 18.1054 |