| Red | Green | Blue | |
| z | 17.64 | ||
| znorm | Inf | ||
| sky | -Inf | -Inf | -Inf |
| S/N | 29.2 | 51.4 | 54.3 |
| S/N(c) | 0.0 | 0.0 | 0.0 |
| SN(E/C) |
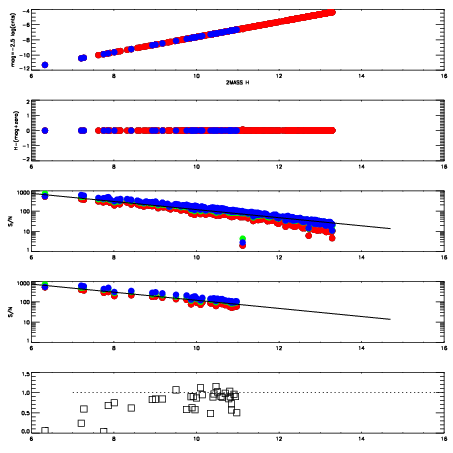
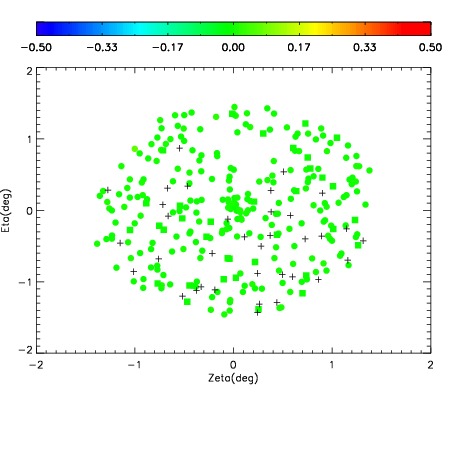
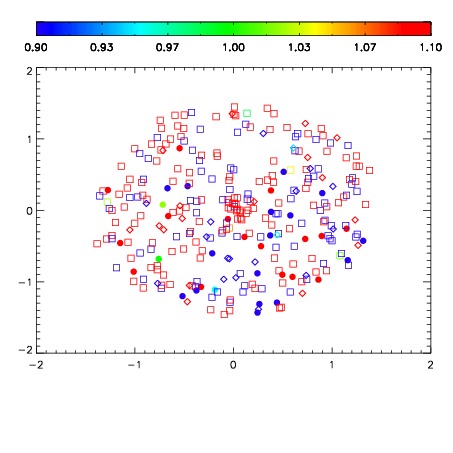


| Frame | Nreads | Zeropoints | Mag plots | Spatial mag deviation | Spatial sky 16325A emission deviations (filled: sky, open: star) | Spatial sky continuum emission | Spatial sky telluric CO2 absorption deviations (filled: H < 10) | |||||||||||||||||||||||
| 0 | 0 |
|
|
|
|
|
|
| IPAIR | NAME | SHIFT | NEWSHIFT | S/N | NAME | SHIFT | NEWSHIFT | S/N |
| 0 | 03970055 | 0.509749 | 0.00000 | 19.1603 | 03970056 | 0.00577734 | 0.503972 | 19.1596 |
| 1 | 03970054 | 0.498489 | 0.0112600 | 19.1491 | 03970053 | -2.83964e-05 | 0.509777 | 19.1172 |
| 2 | 03970051 | 0.503550 | 0.00619900 | 19.1217 | 03970049 | 0.00000 | 0.509749 | 19.0883 |
| 3 | 03970050 | 0.502405 | 0.00734401 | 19.1020 | 03970052 | 0.00311728 | 0.506632 | 19.0759 |