| Red | Green | Blue | |
| z | 17.64 | ||
| znorm | Inf | ||
| sky | -NaN | -Inf | -NaN |
| S/N | 29.8 | 49.2 | 49.8 |
| S/N(c) | 0.0 | 0.0 | 0.0 |
| SN(E/C) |


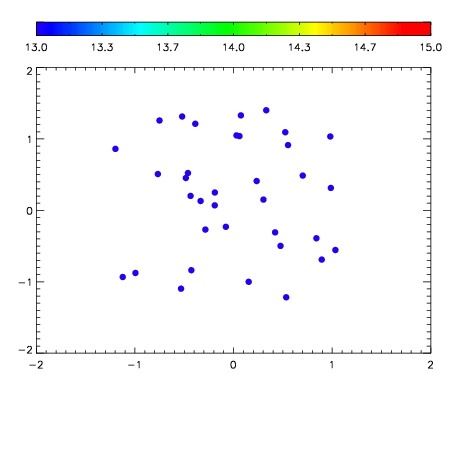

| Frame | Nreads | Zeropoints | Mag plots | Spatial mag deviation | Spatial sky 16325A emission deviations (filled: sky, open: star) | Spatial sky continuum emission | Spatial sky telluric CO2 absorption deviations (filled: H < 10) | |||||||||||||||||||||||
| 0 | 0 |
|
|
|
|
|
|
| IPAIR | NAME | SHIFT | NEWSHIFT | S/N | NAME | SHIFT | NEWSHIFT | S/N |
| 0 | 10150043 | 0.489173 | 0.00000 | 19.1657 | 10150041 | 0.000745911 | 0.488427 | 19.1362 |
| 1 | 10150042 | 0.488978 | 0.000194997 | 19.1865 | 10150044 | -3.74141e-05 | 0.489210 | 19.1781 |
| 2 | 10150038 | 0.488589 | 0.000584006 | 19.1081 | 10150040 | 0.00103348 | 0.488140 | 19.1044 |
| 3 | 10150039 | 0.488173 | 0.000999987 | 19.0624 | 10150037 | 0.00000 | 0.489173 | 19.0888 |