| Red | Green | Blue | |
| z | 17.64 | ||
| znorm | Inf | ||
| sky | -Inf | -Inf | -Inf |
| S/N | 30.1 | 48.8 | 51.2 |
| S/N(c) | 0.0 | 0.0 | 0.0 |
| SN(E/C) |

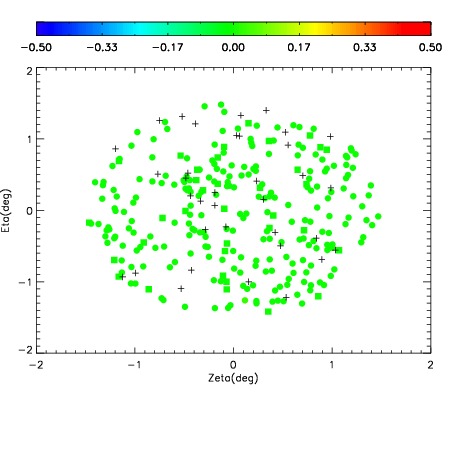

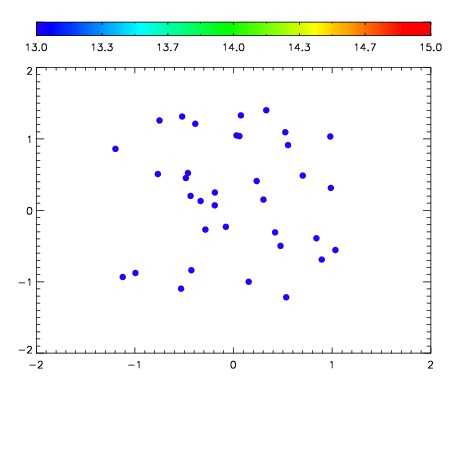

| Frame | Nreads | Zeropoints | Mag plots | Spatial mag deviation | Spatial sky 16325A emission deviations (filled: sky, open: star) | Spatial sky continuum emission | Spatial sky telluric CO2 absorption deviations (filled: H < 10) | |||||||||||||||||||||||
| 0 | 0 |
|
|
|
|
|
|
| IPAIR | NAME | SHIFT | NEWSHIFT | S/N | NAME | SHIFT | NEWSHIFT | S/N |
| 0 | 10430024 | 0.495985 | 0.00000 | 19.0181 | 10430022 | 0.00000 | 0.495985 | 19.0324 |
| 1 | 10430027 | 0.495555 | 0.000429988 | 19.1455 | 10430029 | -0.00582845 | 0.501813 | 19.1300 |
| 2 | 10430028 | 0.495704 | 0.000281006 | 19.1232 | 10430026 | -0.00549791 | 0.501483 | 19.0790 |
| 3 | 10430023 | 0.495672 | 0.000313014 | 19.0947 | 10430025 | -0.00585513 | 0.501840 | 19.0588 |