| Red | Green | Blue | |
| z | 17.64 | ||
| znorm | Inf | ||
| sky | -Inf | -Inf | -Inf |
| S/N | 24.1 | 40.3 | 44.4 |
| S/N(c) | 0.0 | 0.0 | 0.0 |
| SN(E/C) |

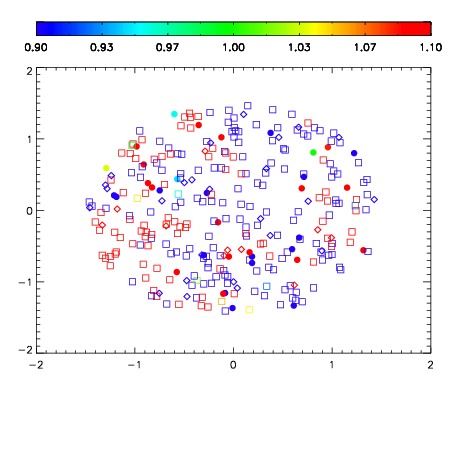


| Frame | Nreads | Zeropoints | Mag plots | Spatial mag deviation | Spatial sky 16325A emission deviations (filled: sky, open: star) | Spatial sky continuum emission | Spatial sky telluric CO2 absorption deviations (filled: H < 10) | |||||||||||||||||||||||
| 0 | 0 |
|
|
|
|
|
|
| IPAIR | NAME | SHIFT | NEWSHIFT | S/N | NAME | SHIFT | NEWSHIFT | S/N |
| 0 | 10270024 | 0.493994 | 0.00000 | 19.1539 | 10270022 | 0.00000 | 0.493994 | 18.8303 |
| 1 | 10270023 | 0.493142 | 0.000851989 | 19.1613 | 10270025 | 0.00136027 | 0.492634 | 19.0484 |
| 2 | 10270027 | 0.493859 | 0.000135005 | 18.7943 | 10270026 | 0.00135127 | 0.492643 | 18.8122 |
| 3 | 10270028 | 0.493983 | 1.09971e-05 | 18.6279 | 10270029 | 0.00367988 | 0.490314 | 17.7208 |