| Red | Green | Blue | |
| z | 17.64 | ||
| znorm | Inf | ||
| sky | -Inf | -Inf | -Inf |
| S/N | 24.9 | 42.7 | 46.0 |
| S/N(c) | 0.0 | 0.0 | 0.0 |
| SN(E/C) |
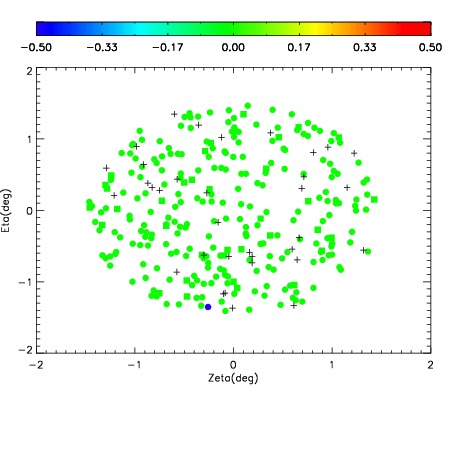
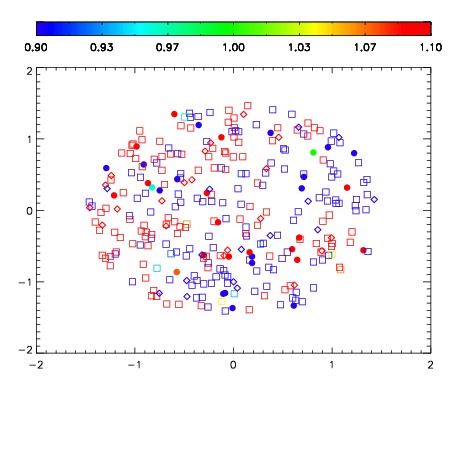
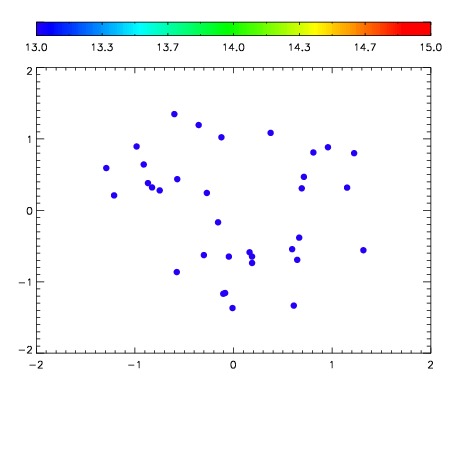

| Frame | Nreads | Zeropoints | Mag plots | Spatial mag deviation | Spatial sky 16325A emission deviations (filled: sky, open: star) | Spatial sky continuum emission | Spatial sky telluric CO2 absorption deviations (filled: H < 10) | |||||||||||||||||||||||
| 0 | 0 |
|
|
|
|
|
|
| IPAIR | NAME | SHIFT | NEWSHIFT | S/N | NAME | SHIFT | NEWSHIFT | S/N |
| 0 | 10520013 | 0.496824 | 0.00000 | 18.9458 | 10520015 | 0.00247410 | 0.494350 | 18.9651 |
| 1 | 10520014 | 0.496780 | 4.39882e-05 | 18.9016 | 10520012 | 0.00000 | 0.496824 | 18.9365 |
| 2 | 10520017 | 0.496273 | 0.000550985 | 18.8140 | 10520019 | 0.0176756 | 0.479148 | 18.8283 |
| 3 | 10520018 | 0.496525 | 0.000299007 | 18.7147 | 10520016 | 0.00209502 | 0.494729 | 18.8235 |