| Red | Green | Blue | |
| z | 17.64 | ||
| znorm | Inf | ||
| sky | -Inf | -Inf | -Inf |
| S/N | 20.4 | 33.6 | 33.6 |
| S/N(c) | 0.0 | 0.0 | 0.0 |
| SN(E/C) |
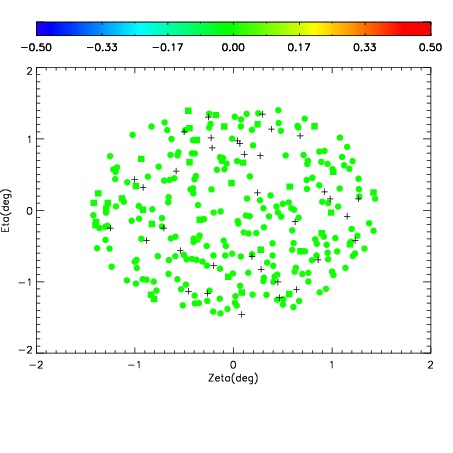
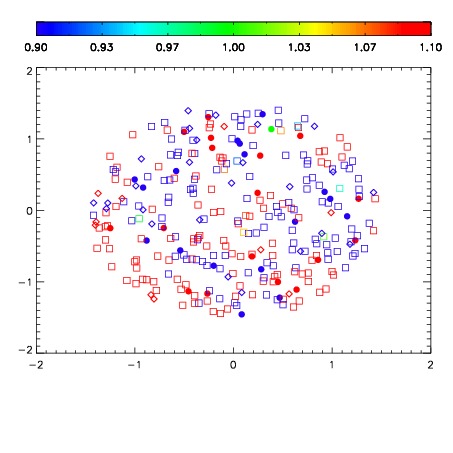


| Frame | Nreads | Zeropoints | Mag plots | Spatial mag deviation | Spatial sky 16325A emission deviations (filled: sky, open: star) | Spatial sky continuum emission | Spatial sky telluric CO2 absorption deviations (filled: H < 10) | |||||||||||||||||||||||
| 0 | 0 |
|
|
|
|
|
|
| IPAIR | NAME | SHIFT | NEWSHIFT | S/N | NAME | SHIFT | NEWSHIFT | S/N |
| 0 | 10420027 | 0.511860 | 0.00000 | 18.8900 | 10420026 | 0.00193765 | 0.509922 | 18.7907 |
| 1 | 10420024 | 0.511365 | 0.000495017 | 18.8015 | 10420025 | 0.00211710 | 0.509743 | 18.7337 |
| 2 | 10420023 | 0.511520 | 0.000339985 | 18.6637 | 10420022 | 0.00000 | 0.511860 | 18.6623 |