| Red | Green | Blue | |
| z | 17.64 | ||
| znorm | Inf | ||
| sky | -Inf | -NaN | -Inf |
| S/N | 23.0 | 41.1 | 41.9 |
| S/N(c) | 0.0 | 0.0 | 0.0 |
| SN(E/C) |
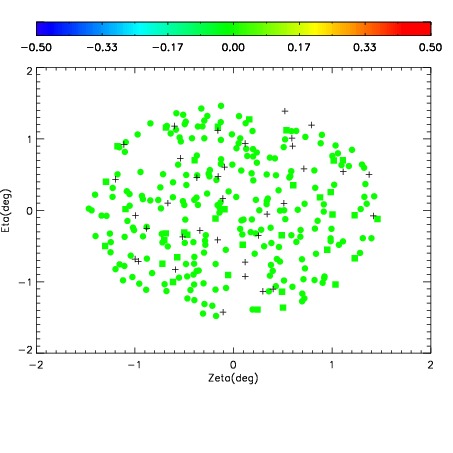
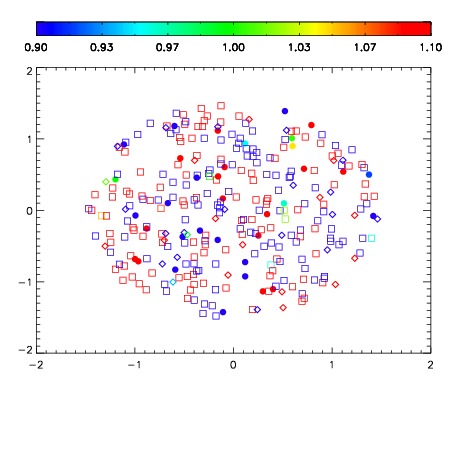
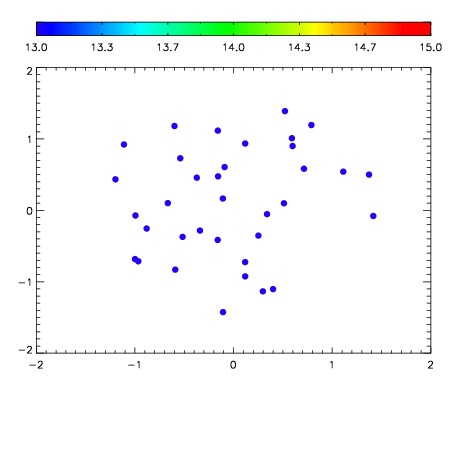

| Frame | Nreads | Zeropoints | Mag plots | Spatial mag deviation | Spatial sky 16325A emission deviations (filled: sky, open: star) | Spatial sky continuum emission | Spatial sky telluric CO2 absorption deviations (filled: H < 10) | |||||||||||||||||||||||
| 0 | 0 |
|
|
|
|
|
|
| IPAIR | NAME | SHIFT | NEWSHIFT | S/N | NAME | SHIFT | NEWSHIFT | S/N |
| 0 | 03440010 | 0.514343 | 0.00000 | 18.6538 | 03440011 | -0.000307520 | 0.514651 | 18.6902 |
| 1 | 03440014 | 0.496763 | 0.0175800 | 19.0153 | 03440015 | -0.00241118 | 0.516754 | 18.8333 |
| 2 | 03440013 | 0.494327 | 0.0200160 | 18.9215 | 03440012 | -0.00323770 | 0.517581 | 18.7183 |
| 3 | 03440009 | 0.509183 | 0.00516003 | 18.5484 | 03440008 | 0.00000 | 0.514343 | 18.6307 |