| Red | Green | Blue | |
| z | 17.64 | ||
| znorm | Inf | ||
| sky | -NaN | -NaN | -Inf |
| S/N | 28.4 | 45.6 | 49.2 |
| S/N(c) | 0.0 | 0.0 | 0.0 |
| SN(E/C) |
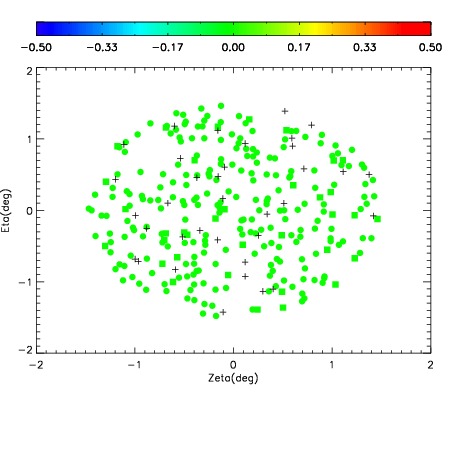
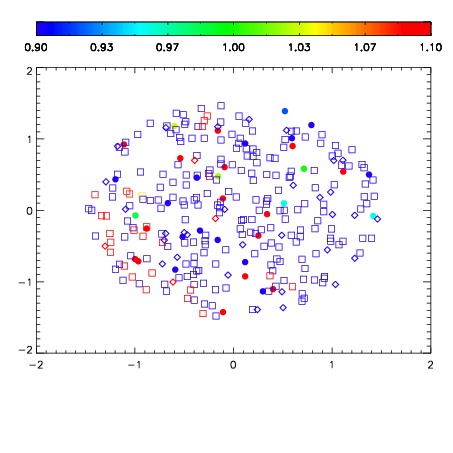


| Frame | Nreads | Zeropoints | Mag plots | Spatial mag deviation | Spatial sky 16325A emission deviations (filled: sky, open: star) | Spatial sky continuum emission | Spatial sky telluric CO2 absorption deviations (filled: H < 10) | |||||||||||||||||||||||
| 0 | 0 |
|
|
|
|
|
|
| IPAIR | NAME | SHIFT | NEWSHIFT | S/N | NAME | SHIFT | NEWSHIFT | S/N |
| 0 | 09990028 | 0.518182 | 0.00000 | 19.1386 | 09990030 | 0.00193113 | 0.516251 | 19.1247 |
| 1 | 09990032 | 0.516412 | 0.00176996 | 19.1507 | 09990029 | 0.00195713 | 0.516225 | 19.1419 |
| 2 | 09990027 | 0.518091 | 9.09567e-05 | 19.0791 | 09990026 | 0.00000 | 0.518182 | 18.8612 |
| 3 | 09990031 | 0.516496 | 0.00168598 | 19.0530 | 09990033 | 0.000641830 | 0.517540 | 18.7985 |