| Red | Green | Blue | |
| z | 17.64 | ||
| znorm | Inf | ||
| sky | -Inf | -NaN | -Inf |
| S/N | 26.6 | 44.2 | 45.5 |
| S/N(c) | 0.0 | 0.0 | 0.0 |
| SN(E/C) |
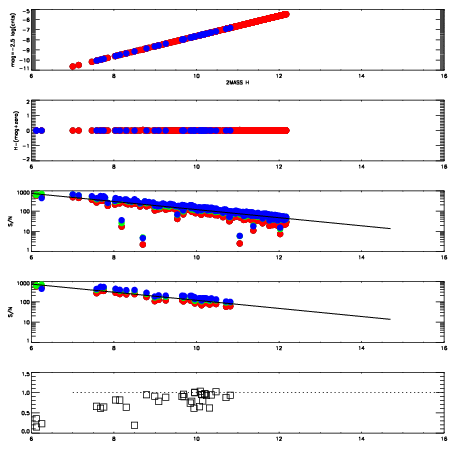
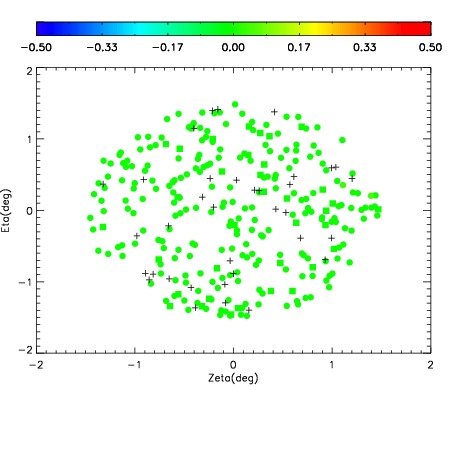
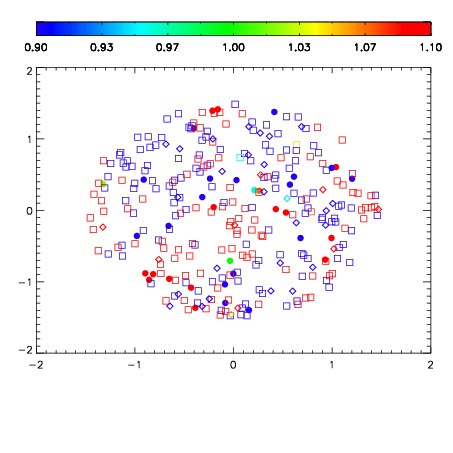
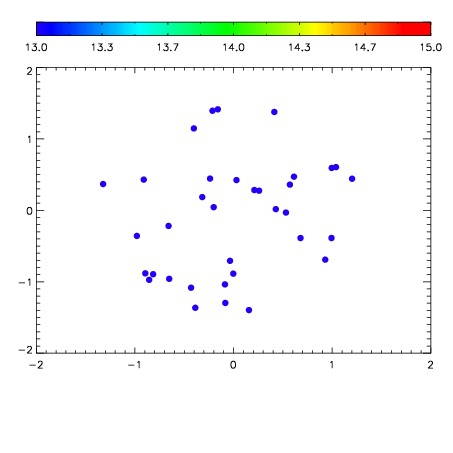

| Frame | Nreads | Zeropoints | Mag plots | Spatial mag deviation | Spatial sky 16325A emission deviations (filled: sky, open: star) | Spatial sky continuum emission | Spatial sky telluric CO2 absorption deviations (filled: H < 10) | |||||||||||||||||||||||
| 0 | 0 |
|
|
|
|
|
|
| IPAIR | NAME | SHIFT | NEWSHIFT | S/N | NAME | SHIFT | NEWSHIFT | S/N |
| 0 | 03430010 | 0.501802 | 0.00000 | 19.1433 | 03430011 | 0.00140072 | 0.500401 | 19.1211 |
| 1 | 03430009 | 0.501161 | 0.000641048 | 19.0900 | 03430015 | 0.00159929 | 0.500203 | 19.0835 |
| 2 | 03430014 | 0.501223 | 0.000579000 | 19.0679 | 03430012 | 0.00166911 | 0.500133 | 19.0567 |
| 3 | 03430013 | 0.499183 | 0.00261903 | 19.0273 | 03430008 | 0.00000 | 0.501802 | 18.9929 |