| Red | Green | Blue | |
| z | 17.64 | ||
| znorm | Inf | ||
| sky | -NaN | -NaN | -Inf |
| S/N | 24.8 | 42.5 | 43.1 |
| S/N(c) | 0.0 | 0.0 | 0.0 |
| SN(E/C) |


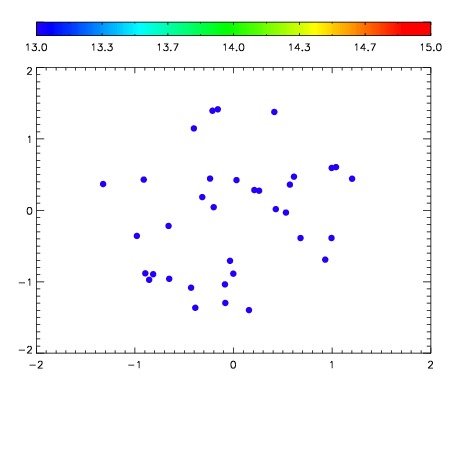

| Frame | Nreads | Zeropoints | Mag plots | Spatial mag deviation | Spatial sky 16325A emission deviations (filled: sky, open: star) | Spatial sky continuum emission | Spatial sky telluric CO2 absorption deviations (filled: H < 10) | |||||||||||||||||||||||
| 0 | 0 |
|
|
|
|
|
|
| IPAIR | NAME | SHIFT | NEWSHIFT | S/N | NAME | SHIFT | NEWSHIFT | S/N |
| 0 | 06670039 | 0.475602 | 0.00000 | 18.9773 | 06670040 | 0.00618506 | 0.469417 | 18.9639 |
| 1 | 06670038 | 0.474542 | 0.00106001 | 18.9927 | 06670044 | 0.00416702 | 0.471435 | 18.9968 |
| 2 | 06670043 | 0.475224 | 0.000378013 | 18.9179 | 06670037 | 0.00000 | 0.475602 | 18.9613 |
| 3 | 06670042 | 0.474323 | 0.00127900 | 18.8771 | 06670041 | 0.00358414 | 0.472018 | 18.9524 |