| Red | Green | Blue | |
| z | 17.64 | ||
| znorm | Inf | ||
| sky | -Inf | -Inf | -Inf |
| S/N | 32.5 | 54.9 | 56.9 |
| S/N(c) | 0.0 | 0.0 | 0.0 |
| SN(E/C) |
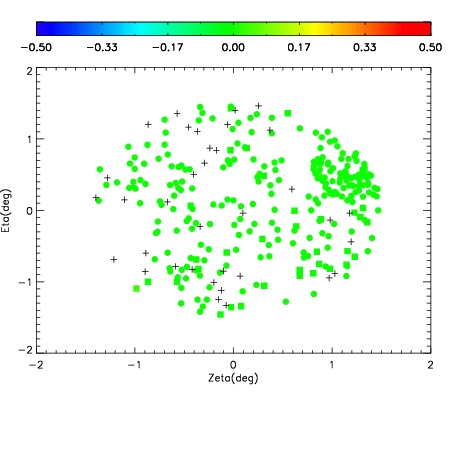
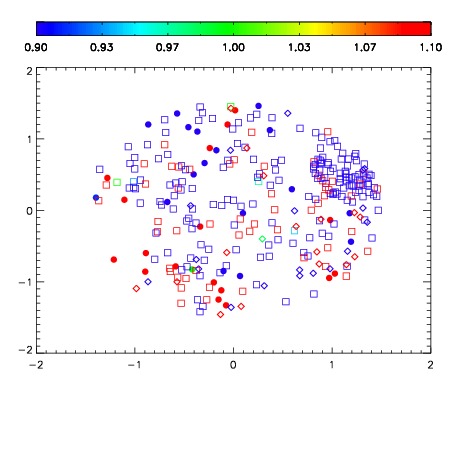


| Frame | Nreads | Zeropoints | Mag plots | Spatial mag deviation | Spatial sky 16325A emission deviations (filled: sky, open: star) | Spatial sky continuum emission | Spatial sky telluric CO2 absorption deviations (filled: H < 10) | |||||||||||||||||||||||
| 0 | 0 |
|
|
|
|
|
|
| IPAIR | NAME | SHIFT | NEWSHIFT | S/N | NAME | SHIFT | NEWSHIFT | S/N |
| 0 | 06990027 | 0.482285 | 0.00000 | 19.2192 | 06990029 | -0.000360624 | 0.482646 | 19.2165 |
| 1 | 06990030 | 0.476980 | 0.00530499 | 19.2172 | 06990028 | 0.000208698 | 0.482076 | 19.2160 |
| 2 | 06990031 | 0.481187 | 0.00109801 | 19.2087 | 06990032 | 0.000542365 | 0.481743 | 19.2061 |
| 3 | 06990026 | 0.477517 | 0.00476798 | 19.2053 | 06990025 | 0.00000 | 0.482285 | 19.2036 |