| Red | Green | Blue | |
| z | 17.64 | ||
| znorm | Inf | ||
| sky | -Inf | -Inf | -NaN |
| S/N | 25.5 | 44.6 | 47.9 |
| S/N(c) | 0.0 | 0.0 | 0.0 |
| SN(E/C) |


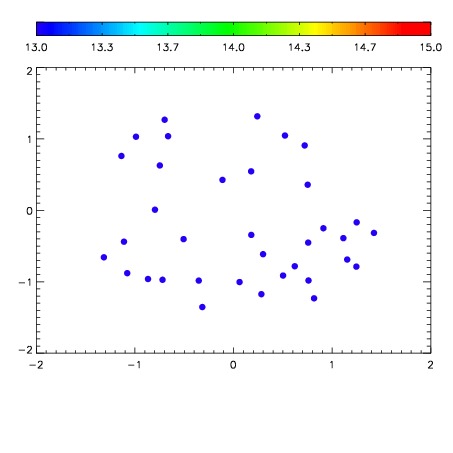

| Frame | Nreads | Zeropoints | Mag plots | Spatial mag deviation | Spatial sky 16325A emission deviations (filled: sky, open: star) | Spatial sky continuum emission | Spatial sky telluric CO2 absorption deviations (filled: H < 10) | |||||||||||||||||||||||
| 0 | 0 |
|
|
|
|
|
|
| IPAIR | NAME | SHIFT | NEWSHIFT | S/N | NAME | SHIFT | NEWSHIFT | S/N |
| 0 | 02930010 | 0.403109 | 0.00000 | 18.7770 | 02930011 | 0.00344796 | 0.399661 | 18.8772 |
| 1 | 02930014 | 0.400713 | 0.00239602 | 19.1127 | 02930015 | 0.00283822 | 0.400271 | 19.1984 |
| 2 | 02930013 | 0.399009 | 0.00410002 | 19.0519 | 02930008 | 0.00000 | 0.403109 | 19.0684 |
| 3 | 02930009 | 0.401262 | 0.00184703 | 18.8209 | 02930012 | 0.00306301 | 0.400046 | 18.9154 |