| Red | Green | Blue | |
| z | 17.64 | ||
| znorm | Inf | ||
| sky | -Inf | -Inf | -NaN |
| S/N | 27.0 | 45.4 | 48.8 |
| S/N(c) | 0.0 | 0.0 | 0.0 |
| SN(E/C) |
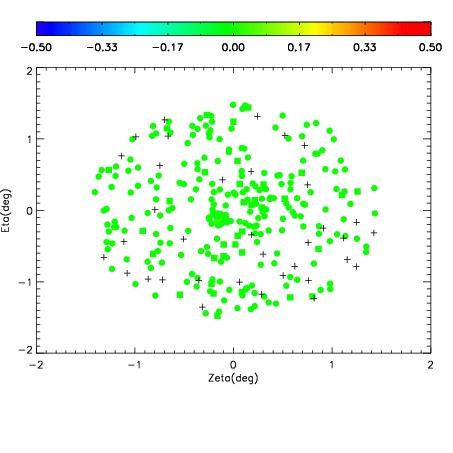
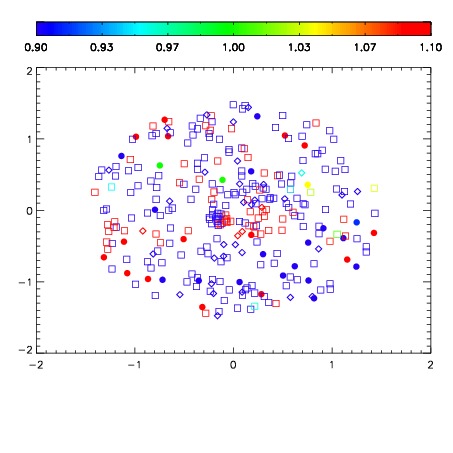
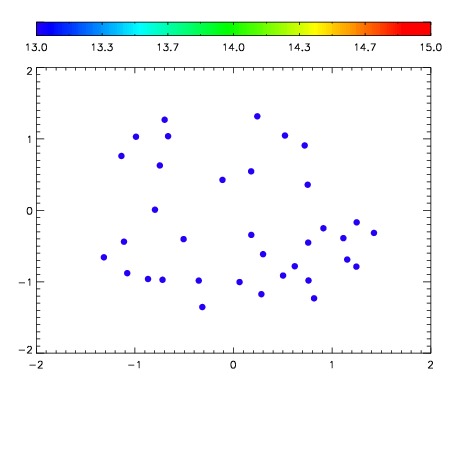

| Frame | Nreads | Zeropoints | Mag plots | Spatial mag deviation | Spatial sky 16325A emission deviations (filled: sky, open: star) | Spatial sky continuum emission | Spatial sky telluric CO2 absorption deviations (filled: H < 10) | |||||||||||||||||||||||
| 0 | 0 |
|
|
|
|
|
|
| IPAIR | NAME | SHIFT | NEWSHIFT | S/N | NAME | SHIFT | NEWSHIFT | S/N |
| 0 | 03200023 | 0.509474 | 0.00000 | 18.9548 | 03200024 | -0.000876838 | 0.510351 | 19.0967 |
| 1 | 03200022 | 0.501918 | 0.00755596 | 18.9980 | 03200025 | -0.00226796 | 0.511742 | 19.1682 |
| 2 | 03200026 | 0.496450 | 0.0130240 | 18.9534 | 03200028 | -0.00266825 | 0.512142 | 18.9872 |
| 3 | 03200027 | 0.504651 | 0.00482297 | 18.7229 | 03200021 | 0.00000 | 0.509474 | 18.9028 |