| Red | Green | Blue | |
| z | 17.64 | ||
| znorm | Inf | ||
| sky | -Inf | -NaN | -Inf |
| S/N | 26.1 | 46.7 | 50.1 |
| S/N(c) | 0.0 | 0.0 | 0.0 |
| SN(E/C) |
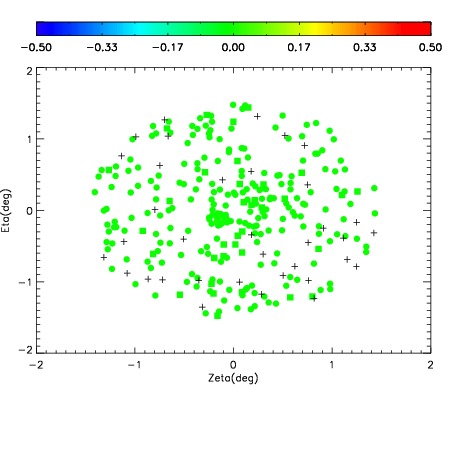
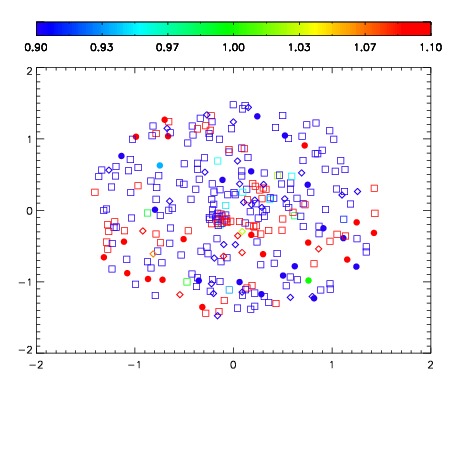
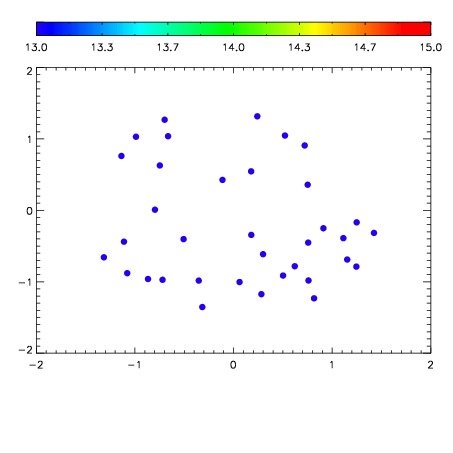

| Frame | Nreads | Zeropoints | Mag plots | Spatial mag deviation | Spatial sky 16325A emission deviations (filled: sky, open: star) | Spatial sky continuum emission | Spatial sky telluric CO2 absorption deviations (filled: H < 10) | |||||||||||||||||||||||
| 0 | 0 |
|
|
|
|
|
|
| IPAIR | NAME | SHIFT | NEWSHIFT | S/N | NAME | SHIFT | NEWSHIFT | S/N |
| 0 | 03410054 | 0.497527 | 0.00000 | 18.9910 | 03410055 | -0.000990392 | 0.498517 | 19.0656 |
| 1 | 03410050 | 0.496434 | 0.00109300 | 18.9149 | 03410052 | -0.00167840 | 0.499205 | 19.0211 |
| 2 | 03410049 | 0.495238 | 0.00228900 | 18.8912 | 03410051 | -0.00194073 | 0.499468 | 18.9721 |
| 3 | 03410053 | 0.496665 | 0.000862002 | 18.7977 | 03410048 | 0.00000 | 0.497527 | 18.9134 |