| Red | Green | Blue | |
| z | 17.64 | ||
| znorm | Inf | ||
| sky | -NaN | -NaN | -Inf |
| S/N | 28.1 | 48.5 | 53.3 |
| S/N(c) | 0.0 | 0.0 | 0.0 |
| SN(E/C) |
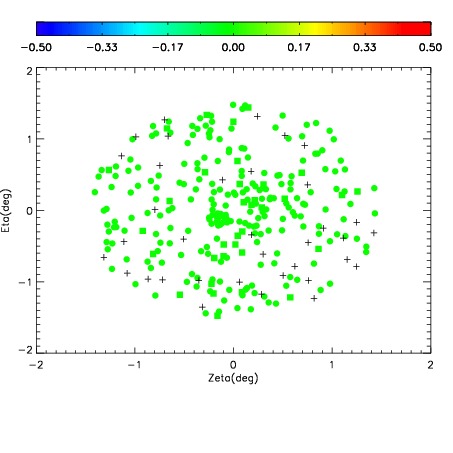
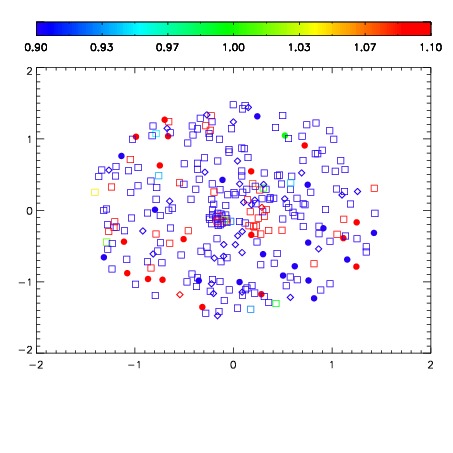


| Frame | Nreads | Zeropoints | Mag plots | Spatial mag deviation | Spatial sky 16325A emission deviations (filled: sky, open: star) | Spatial sky continuum emission | Spatial sky telluric CO2 absorption deviations (filled: H < 10) | |||||||||||||||||||||||
| 0 | 0 |
|
|
|
|
|
|
| IPAIR | NAME | SHIFT | NEWSHIFT | S/N | NAME | SHIFT | NEWSHIFT | S/N |
| 0 | 03700044 | 0.497712 | 0.00000 | 19.1466 | 03700042 | -0.00210668 | 0.499819 | 19.1896 |
| 1 | 03700043 | 0.491413 | 0.00629899 | 19.1187 | 03700041 | -0.00131754 | 0.499030 | 19.0661 |
| 2 | 03700040 | 0.497208 | 0.000503987 | 18.9720 | 03700045 | -0.00133335 | 0.499045 | 19.0290 |
| 3 | 03700039 | 0.494414 | 0.00329798 | 18.9243 | 03700038 | 0.00000 | 0.497712 | 18.8553 |