| Red | Green | Blue | |
| z | 17.64 | ||
| znorm | Inf | ||
| sky | -Inf | -Inf | -Inf |
| S/N | 19.0 | 33.9 | 36.1 |
| S/N(c) | 0.0 | 0.0 | 0.0 |
| SN(E/C) |
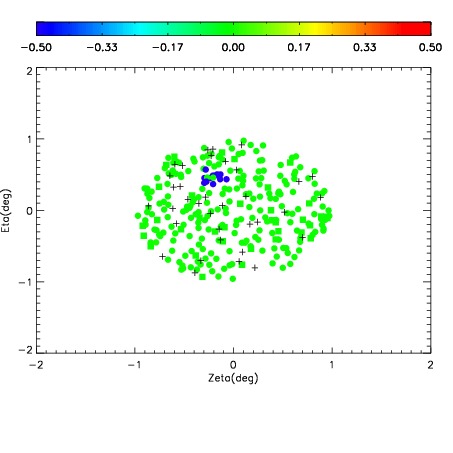
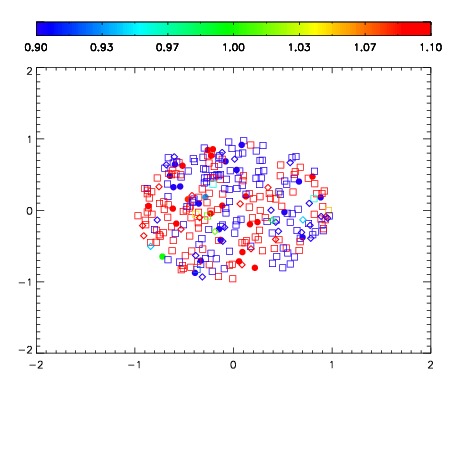
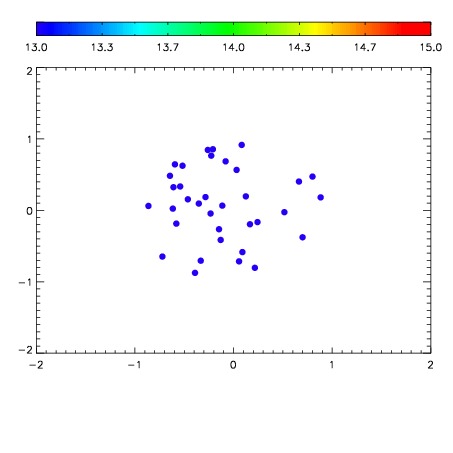

| Frame | Nreads | Zeropoints | Mag plots | Spatial mag deviation | Spatial sky 16325A emission deviations (filled: sky, open: star) | Spatial sky continuum emission | Spatial sky telluric CO2 absorption deviations (filled: H < 10) | |||||||||||||||||||||||
| 0 | 0 |
|
|
|
|
|
|
| IPAIR | NAME | SHIFT | NEWSHIFT | S/N | NAME | SHIFT | NEWSHIFT | S/N |
| 0 | 03190062 | 0.510259 | 0.00000 | 18.7367 | 03190059 | 7.06963e-05 | 0.510188 | 18.6959 |
| 1 | 03190057 | 0.494491 | 0.0157680 | 18.8289 | 03190056 | 0.00000 | 0.510259 | 18.8561 |
| 2 | 03190061 | 0.500431 | 0.00982797 | 18.5986 | 03190063 | 0.00184496 | 0.508414 | 18.6820 |
| 3 | 03190058 | 0.499961 | 0.0102980 | 18.4429 | 03190060 | -0.00228841 | 0.512547 | 18.5509 |