| Red | Green | Blue | |
| z | 17.64 | ||
| znorm | Inf | ||
| sky | -Inf | -Inf | -Inf |
| S/N | 24.1 | 42.6 | 46.5 |
| S/N(c) | 0.0 | 0.0 | 0.0 |
| SN(E/C) |
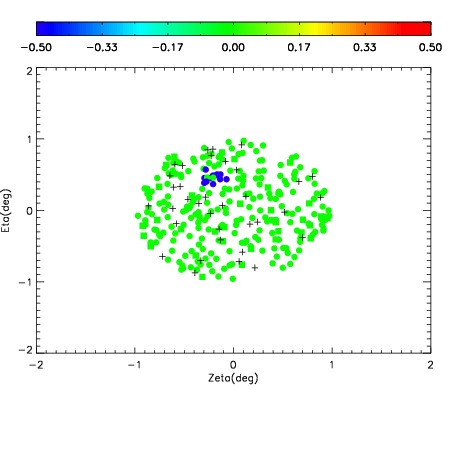
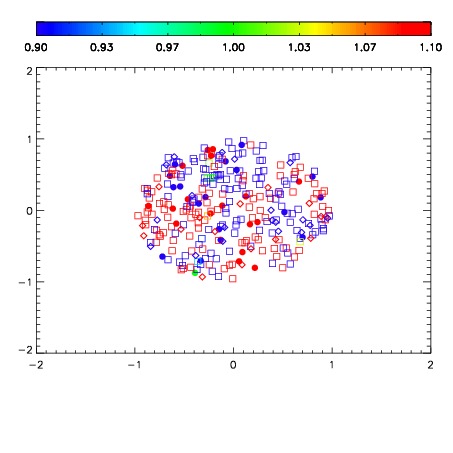
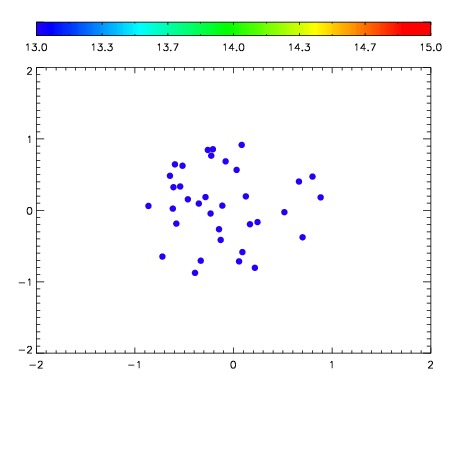

| Frame | Nreads | Zeropoints | Mag plots | Spatial mag deviation | Spatial sky 16325A emission deviations (filled: sky, open: star) | Spatial sky continuum emission | Spatial sky telluric CO2 absorption deviations (filled: H < 10) | |||||||||||||||||||||||
| 0 | 0 |
|
|
|
|
|
|
| IPAIR | NAME | SHIFT | NEWSHIFT | S/N | NAME | SHIFT | NEWSHIFT | S/N |
| 0 | 03200042 | 0.515111 | 0.00000 | 18.9233 | 03200039 | 0.00221611 | 0.512895 | 18.8839 |
| 1 | 03200041 | 0.505631 | 0.00948000 | 18.8133 | 03200040 | 0.00155924 | 0.513552 | 18.8746 |
| 2 | 03200038 | 0.509137 | 0.00597405 | 18.7778 | 03200043 | 0.00330920 | 0.511802 | 18.8503 |
| 3 | 03200037 | 0.503651 | 0.0114600 | 18.6597 | 03200036 | 0.00113242 | 0.513979 | 18.5505 |
| 4 | 03200034 | 0.508975 | 0.00613600 | 18.3460 | 03200035 | 0.00128941 | 0.513822 | 18.4519 |
| 5 | 03200033 | 0.507860 | 0.00725102 | 18.1787 | 03200032 | 0.00000 | 0.515111 | 17.9347 |