| Red | Green | Blue | |
| z | 17.64 | ||
| znorm | Inf | ||
| sky | -Inf | -Inf | -Inf |
| S/N | 23.3 | 40.8 | 44.8 |
| S/N(c) | 0.0 | 0.0 | 0.0 |
| SN(E/C) |


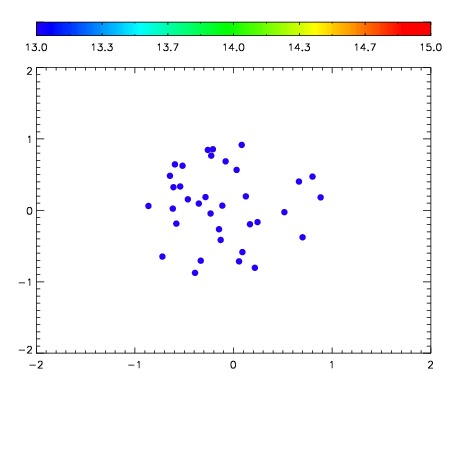

| Frame | Nreads | Zeropoints | Mag plots | Spatial mag deviation | Spatial sky 16325A emission deviations (filled: sky, open: star) | Spatial sky continuum emission | Spatial sky telluric CO2 absorption deviations (filled: H < 10) | |||||||||||||||||||||||
| 0 | 0 |
|
|
|
|
|
|
| IPAIR | NAME | SHIFT | NEWSHIFT | S/N | NAME | SHIFT | NEWSHIFT | S/N |
| 0 | 06650098 | 0.481855 | 0.00000 | 18.6378 | 06650100 | -0.00472444 | 0.486579 | 18.5702 |
| 1 | 06650094 | 0.480305 | 0.00155002 | 18.8356 | 06650095 | -0.000223043 | 0.482078 | 18.8199 |
| 2 | 06650093 | 0.480390 | 0.00146499 | 18.8034 | 06650092 | 0.00000 | 0.481855 | 18.7298 |
| 3 | 06650097 | 0.480839 | 0.00101599 | 18.7591 | 06650096 | -0.00186008 | 0.483715 | 18.6015 |
| 4 | 06650101 | 0.479300 | 0.00255501 | 18.6065 | 06650099 | 0.000627584 | 0.481227 | 18.5198 |
| 5 | 06650102 | 0.480493 | 0.00136200 | 18.4060 | 06650103 | 5.48031e-05 | 0.481800 | 18.4137 |