| Red | Green | Blue | |
| z | 17.64 | ||
| znorm | Inf | ||
| sky | -NaN | -Inf | -NaN |
| S/N | 26.8 | 46.6 | 49.7 |
| S/N(c) | 0.0 | 0.0 | 0.0 |
| SN(E/C) |
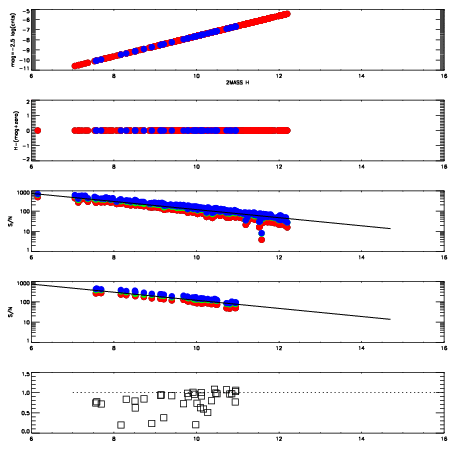
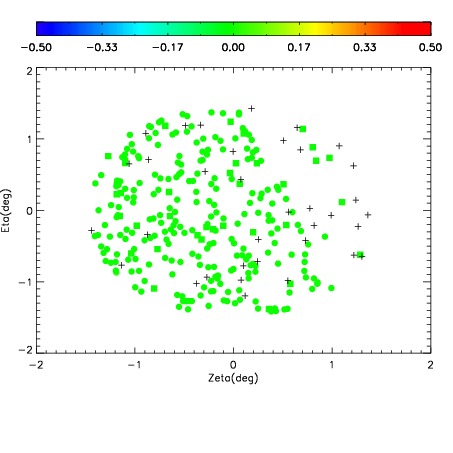
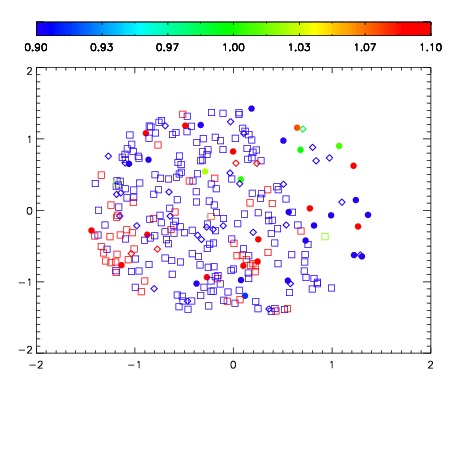
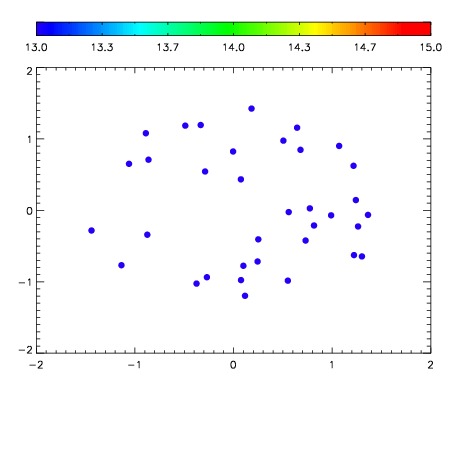

| Frame | Nreads | Zeropoints | Mag plots | Spatial mag deviation | Spatial sky 16325A emission deviations (filled: sky, open: star) | Spatial sky continuum emission | Spatial sky telluric CO2 absorption deviations (filled: H < 10) | |||||||||||||||||||||||
| 0 | 0 |
|
|
|
|
|
|
| IPAIR | NAME | SHIFT | NEWSHIFT | S/N | NAME | SHIFT | NEWSHIFT | S/N |
| 0 | 03180038 | 0.499522 | 0.00000 | 19.0446 | 03180040 | 0.000976493 | 0.498545 | 19.0008 |
| 1 | 03180037 | 0.493790 | 0.00573200 | 19.0243 | 03180036 | 0.00000 | 0.499522 | 18.9834 |
| 2 | 03180042 | 0.498170 | 0.00135201 | 19.0022 | 03180039 | 0.00106480 | 0.498457 | 18.9689 |
| 3 | 03180041 | 0.496414 | 0.00310799 | 18.9522 | 03180043 | 0.00244050 | 0.497081 | 18.9213 |