| Red | Green | Blue | |
| z | 17.64 | ||
| znorm | Inf | ||
| sky | -Inf | -NaN | -NaN |
| S/N | 18.9 | 33.5 | 34.7 |
| S/N(c) | 0.0 | 0.0 | 0.0 |
| SN(E/C) |
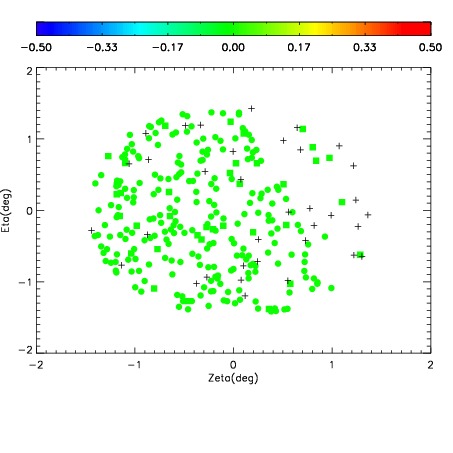
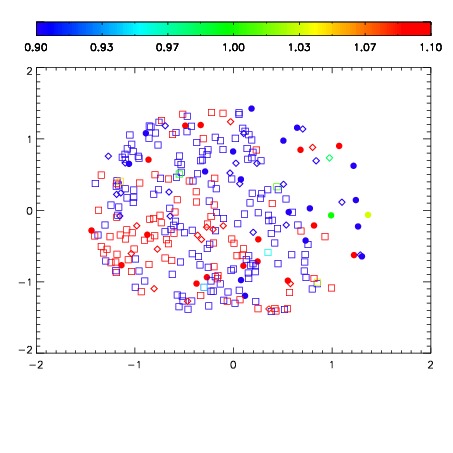


| Frame | Nreads | Zeropoints | Mag plots | Spatial mag deviation | Spatial sky 16325A emission deviations (filled: sky, open: star) | Spatial sky continuum emission | Spatial sky telluric CO2 absorption deviations (filled: H < 10) | |||||||||||||||||||||||
| 0 | 0 |
|
|
|
|
|
|
| IPAIR | NAME | SHIFT | NEWSHIFT | S/N | NAME | SHIFT | NEWSHIFT | S/N |
| 0 | 03770030 | 0.508993 | 0.00000 | 17.3766 | 03770029 | 0.00235084 | 0.506642 | 17.6967 |
| 1 | 03770026 | 0.504810 | 0.00418305 | 19.0066 | 03770032 | 0.00282212 | 0.506171 | 18.8216 |
| 2 | 03770027 | 0.507000 | 0.00199300 | 18.5895 | 03770025 | 0.00000 | 0.508993 | 18.7448 |
| 3 | 03770031 | 0.508966 | 2.70009e-05 | 18.1280 | 03770028 | 0.00259626 | 0.506397 | 18.0554 |