| Red | Green | Blue | |
| z | 17.64 | ||
| znorm | Inf | ||
| sky | -NaN | -Inf | -Inf |
| S/N | 33.2 | 55.8 | 61.6 |
| S/N(c) | 0.0 | 0.0 | 0.0 |
| SN(E/C) |


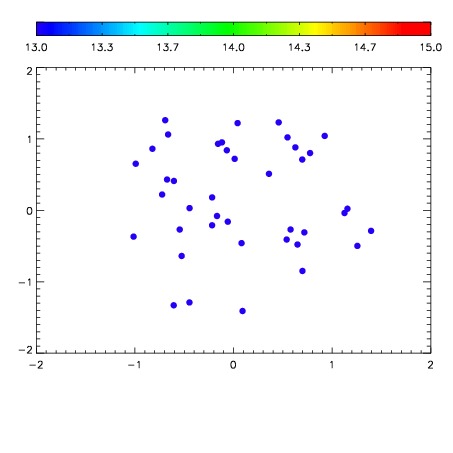

| Frame | Nreads | Zeropoints | Mag plots | Spatial mag deviation | Spatial sky 16325A emission deviations (filled: sky, open: star) | Spatial sky continuum emission | Spatial sky telluric CO2 absorption deviations (filled: H < 10) | |||||||||||||||||||||||
| 0 | 0 |
|
|
|
|
|
|
| IPAIR | NAME | SHIFT | NEWSHIFT | S/N | NAME | SHIFT | NEWSHIFT | S/N |
| 0 | 04040042 | 0.496034 | 0.00000 | 19.1806 | 04040040 | 0.000333616 | 0.495700 | 19.1653 |
| 1 | 04040037 | 0.494136 | 0.00189799 | 19.2564 | 04040043 | -0.000622432 | 0.496656 | 19.2551 |
| 2 | 04040038 | 0.494442 | 0.00159201 | 19.2516 | 04040036 | 0.00000 | 0.496034 | 19.2304 |
| 3 | 04040041 | 0.495504 | 0.000530005 | 19.2087 | 04040039 | 0.000850174 | 0.495184 | 19.2217 |