| Red | Green | Blue | |
| z | 17.64 | ||
| znorm | Inf | ||
| sky | -Inf | -Inf | -Inf |
| S/N | 26.2 | 44.6 | 49.4 |
| S/N(c) | 0.0 | 0.0 | 0.0 |
| SN(E/C) |
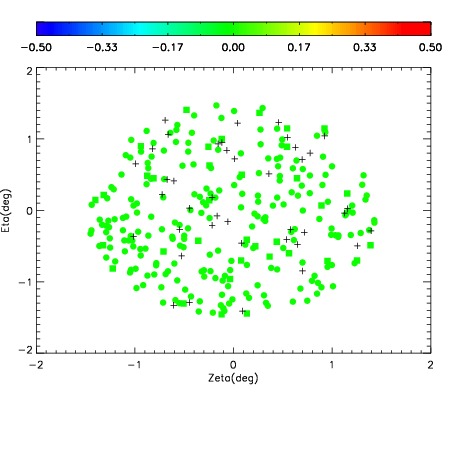
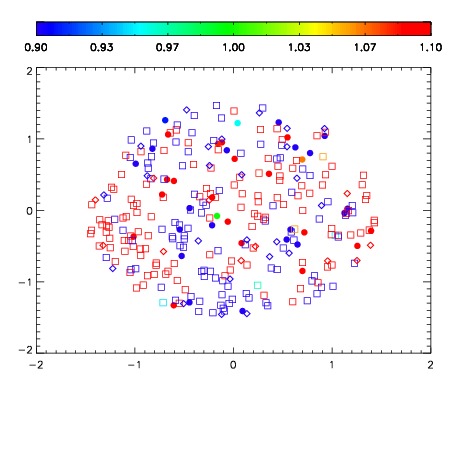


| Frame | Nreads | Zeropoints | Mag plots | Spatial mag deviation | Spatial sky 16325A emission deviations (filled: sky, open: star) | Spatial sky continuum emission | Spatial sky telluric CO2 absorption deviations (filled: H < 10) | |||||||||||||||||||||||
| 0 | 0 |
|
|
|
|
|
|
| IPAIR | NAME | SHIFT | NEWSHIFT | S/N | NAME | SHIFT | NEWSHIFT | S/N |
| 0 | 04290029 | 0.507993 | 0.00000 | 18.9901 | 04290027 | 7.13390e-05 | 0.507922 | 19.0303 |
| 1 | 04290025 | 0.503650 | 0.00434297 | 18.9841 | 04290030 | 0.000916811 | 0.507076 | 19.0229 |
| 2 | 04290024 | 0.495291 | 0.0127020 | 18.9772 | 04290026 | 0.000183048 | 0.507810 | 18.9817 |
| 3 | 04290028 | 0.502721 | 0.00527197 | 18.9629 | 04290023 | 0.00000 | 0.507993 | 18.9185 |