| Red | Green | Blue | |
| z | 17.64 | ||
| znorm | Inf | ||
| sky | -Inf | -Inf | -Inf |
| S/N | 29.6 | 50.9 | 55.0 |
| S/N(c) | 0.0 | 0.0 | 0.0 |
| SN(E/C) |


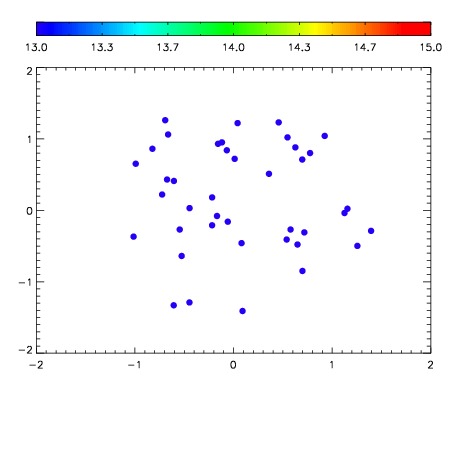

| Frame | Nreads | Zeropoints | Mag plots | Spatial mag deviation | Spatial sky 16325A emission deviations (filled: sky, open: star) | Spatial sky continuum emission | Spatial sky telluric CO2 absorption deviations (filled: H < 10) | |||||||||||||||||||||||
| 0 | 0 |
|
|
|
|
|
|
| IPAIR | NAME | SHIFT | NEWSHIFT | S/N | NAME | SHIFT | NEWSHIFT | S/N |
| 0 | 06750038 | 0.489520 | 0.00000 | 19.0631 | 06750036 | 0.00000 | 0.489520 | 19.0648 |
| 1 | 06750042 | 0.488977 | 0.000543028 | 19.1209 | 06750043 | -0.00291055 | 0.492431 | 19.1477 |
| 2 | 06750037 | 0.488488 | 0.00103202 | 19.1081 | 06750040 | -0.00212380 | 0.491644 | 19.1115 |
| 3 | 06750041 | 0.488244 | 0.00127602 | 19.0690 | 06750039 | -0.00114515 | 0.490665 | 19.1077 |