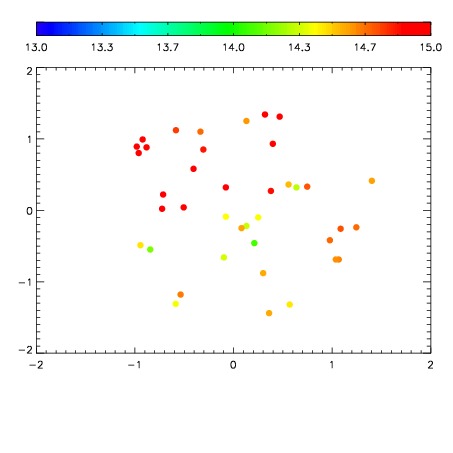
| Frame | Nreads | Zeropoints | Mag plots
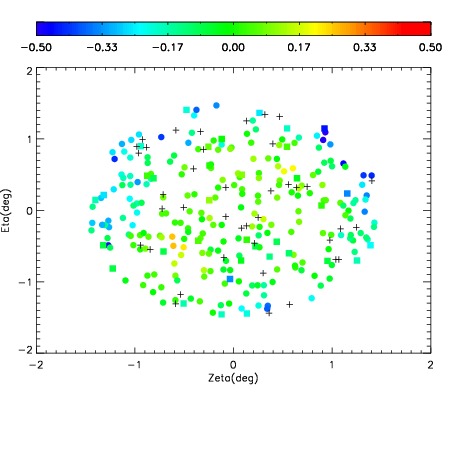
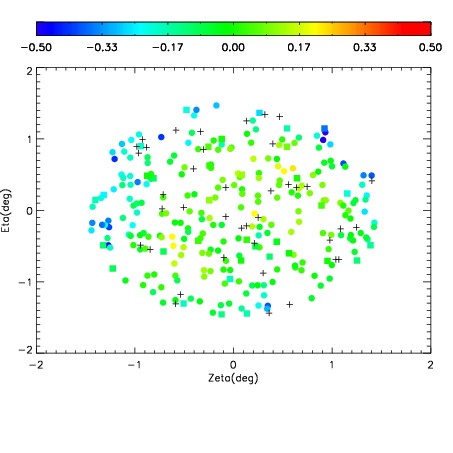
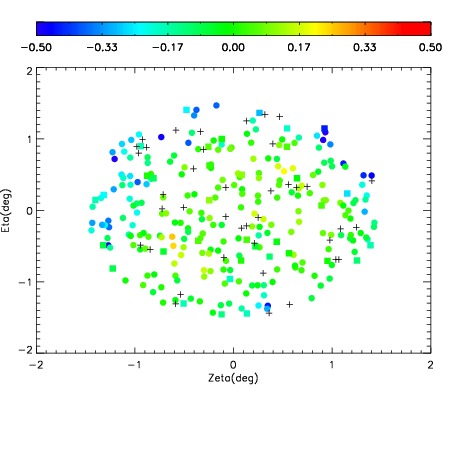
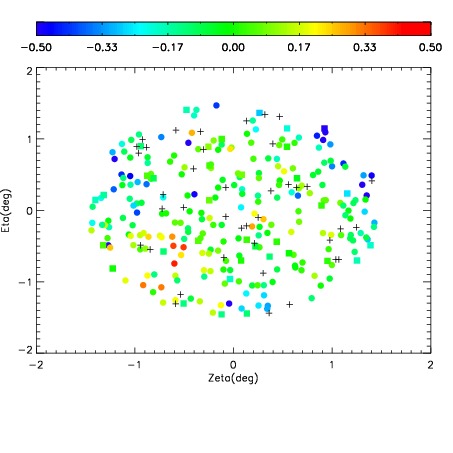
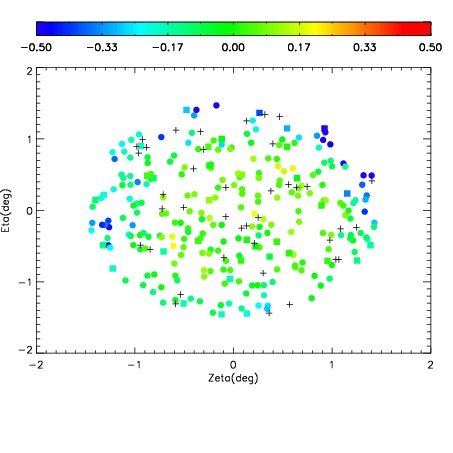
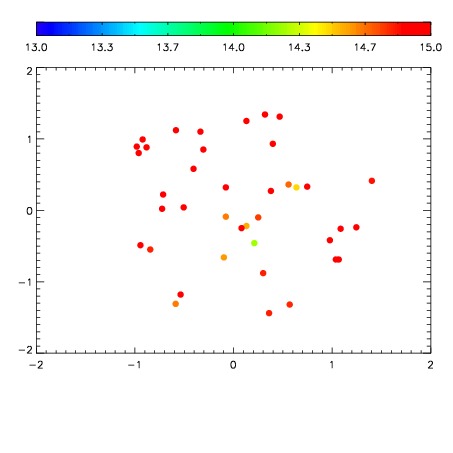
| Spatial mag deviation
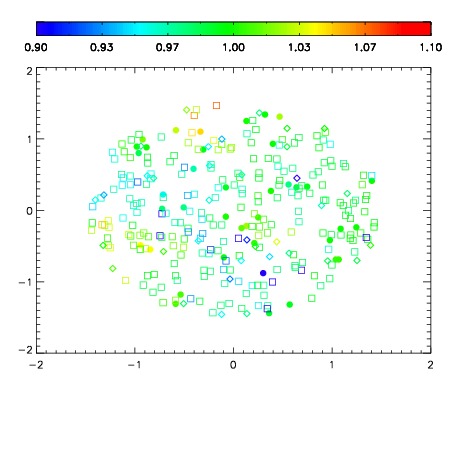
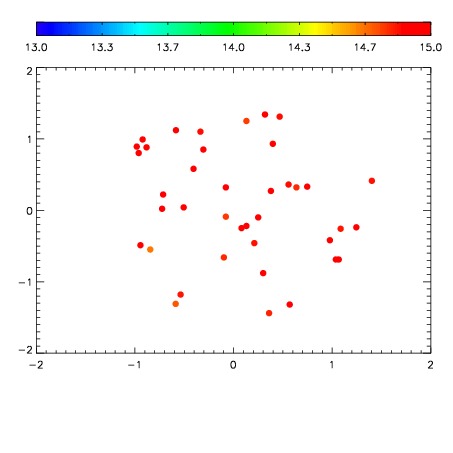
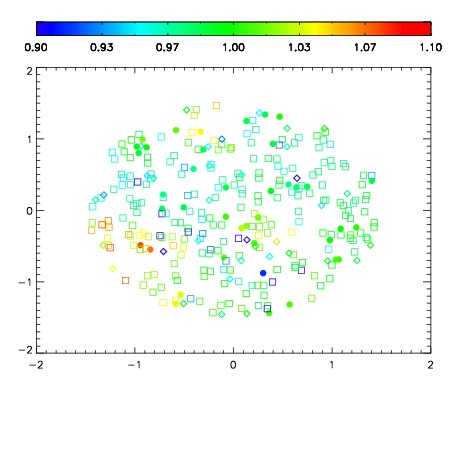
| Spatial sky 16325A emission deviations (filled: sky, open: star)
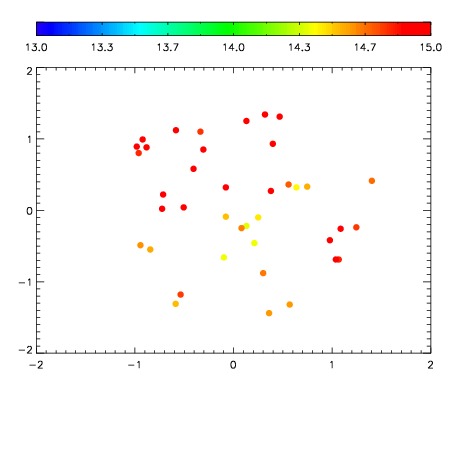
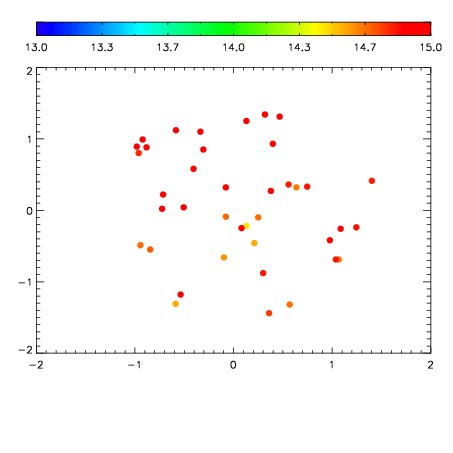
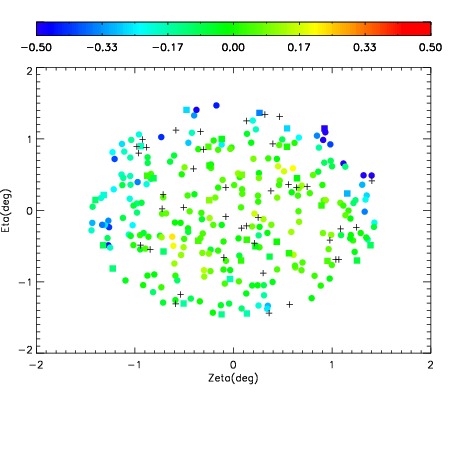
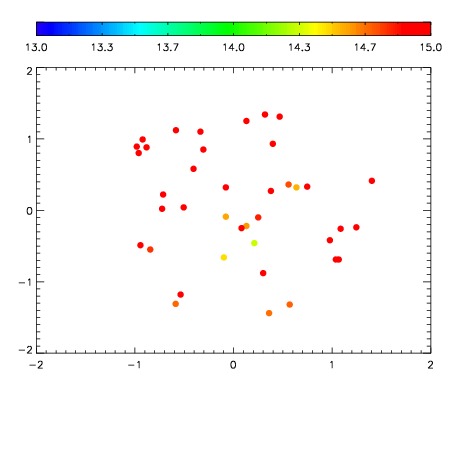
| Spatial sky continuum emission
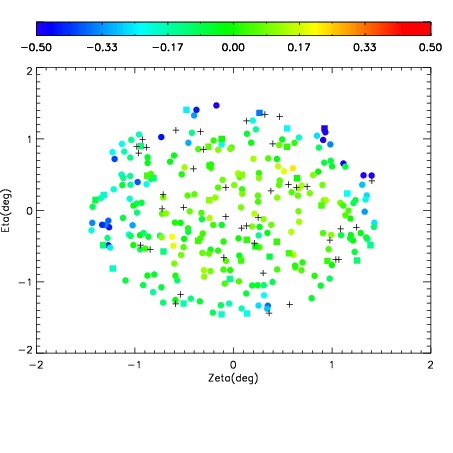
| Spatial sky telluric CO2 absorption deviations (filled: H < 10)
|
| 3100087
| 47
| | Red | Green | Blue
| | z | | 18.64
| | znorm | | 14.46
| | sky | 15.3 | 14.7 | 14.8
| | S/N | 12.2 | 20.1 | 20.4
| | S/N(c) | 7.5 | 30.6 | 22.2
| | SN(E/C) 0.96
|
| 
| 
| 
| 
| 
|
| 3100088
| 47
| | Red | Green | Blue
| | z | | 18.48
| | znorm | | 14.30
| | sky | 15.5 | 14.8 | 14.9
| | S/N | 11.1 | 18.9 | 19.2
| | S/N(c) | 6.8 | 29.0 | 21.0
| | SN(E/C) 0.98
|
| 
| 
| 
| 
| 
|
| 3100089
| 47
| | Red | Green | Blue
| | z | | 18.10
| | znorm | | 13.92
| | sky | 15.1 | 14.9 | 14.9
| | S/N | 8.4 | 15.0 | 15.5
| | S/N(c) | 5.3 | 23.3 | 17.0
| | SN(E/C) 0.99
|
| 
| 
| 
| 
| 
|
| 3100090
| 47
| | Red | Green | Blue
| | z | | 16.39
| | znorm | | 12.21
| | sky | 15.2 | 14.9 | 15.1
| | S/N | 1.7 | 4.1 | 4.6
| | S/N(c) | 1.4 | 8.5 | 6.3
| | SN(E/C) 1.13
|
| 
| 
| 
| 
| 
|
| 3100091
| 47
| | Red | Green | Blue
| | z | | 18.46
| | znorm | | 14.28
| | sky | 14.9 | 14.9 | 14.9
| | S/N | 10.6 | 18.3 | 19.2
| | S/N(c) | 6.7 | 27.9 | 20.3
| | SN(E/C) 0.98
|
| 
| 
| 
| 
| 
|
| 3100092
| 47
| | Red | Green | Blue
| | z | | 18.88
| | znorm | | 14.70
| | sky | 15.3 | 15.1 | 14.9
| | S/N | 14.2 | 23.7 | 24.7
| | S/N(c) | 8.8 | 34.2 | 24.9
| | SN(E/C) 0.97
|
| 
| 
| 
| 
| 
|
| 3100093
| 47
| | Red | Green | Blue
| | z | | 18.70
| | znorm | | 14.52
| | sky | 14.9 | 15.0 | 15.0
| | S/N | 12.4 | 21.4 | 22.3
| | S/N(c) | 7.7 | 31.7 | 23.1
| | SN(E/C) 0.97
|
| 
| 
| 
| 
| 
|
| 3100094
| 47
| | Red | Green | Blue
| | z | | 18.89
| | znorm | | 14.71
| | sky | 15.6 | 15.0 | 14.9
| | S/N | 14.8 | 23.9 | 24.9
| | S/N(c) | 8.7 | 35.0 | 25.7
| | SN(E/C) 0.97
|
| 
| 
| 
| 
| 
|