| Red | Green | Blue | |
| z | 17.64 | ||
| znorm | Inf | ||
| sky | -NaN | -Inf | -Inf |
| S/N | 19.6 | 33.9 | 36.3 |
| S/N(c) | 0.0 | 0.0 | 0.0 |
| SN(E/C) |
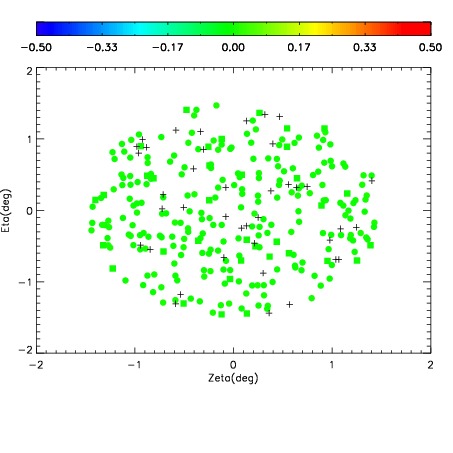
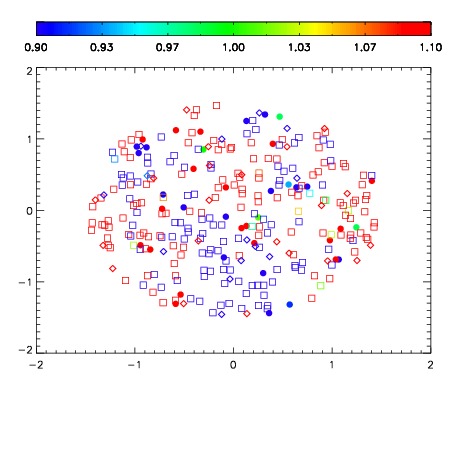
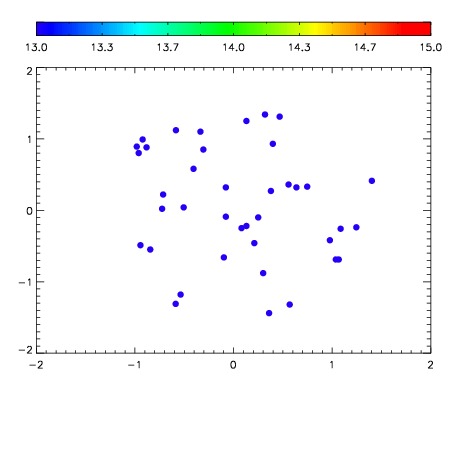

| Frame | Nreads | Zeropoints | Mag plots | Spatial mag deviation | Spatial sky 16325A emission deviations (filled: sky, open: star) | Spatial sky continuum emission | Spatial sky telluric CO2 absorption deviations (filled: H < 10) | |||||||||||||||||||||||
| 0 | 0 |
|
|
|
|
|
|
| IPAIR | NAME | SHIFT | NEWSHIFT | S/N | NAME | SHIFT | NEWSHIFT | S/N |
| 0 | 03100093 | 0.500867 | 0.00000 | 18.6624 | 03100087 | 0.00000 | 0.500867 | 18.6024 |
| 1 | 03100092 | 0.500253 | 0.000613987 | 18.8358 | 03100094 | 0.00578095 | 0.495086 | 18.8583 |
| 2 | 03100088 | 0.499559 | 0.00130802 | 18.4472 | 03100091 | 0.00534598 | 0.495521 | 18.4289 |
| 3 | 03100089 | 0.500357 | 0.000510037 | 18.0682 | 03100090 | 0.00603178 | 0.494835 | 16.4066 |