| Red | Green | Blue | |
| z | 17.64 | ||
| znorm | Inf | ||
| sky | -Inf | -NaN | -Inf |
| S/N | 30.8 | 52.0 | 54.3 |
| S/N(c) | 0.0 | 0.0 | 0.0 |
| SN(E/C) |
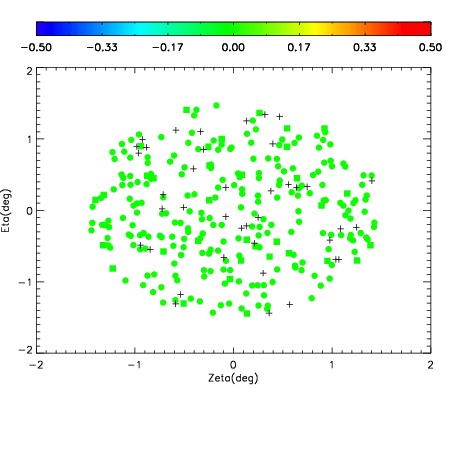

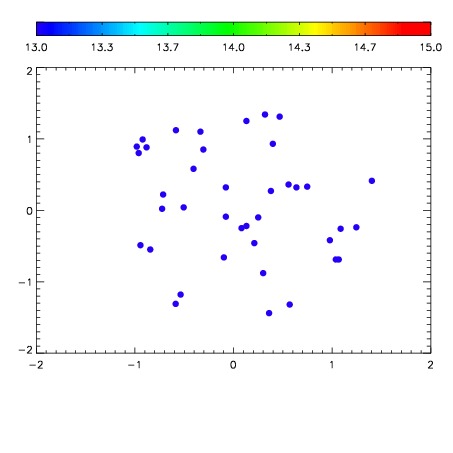

| Frame | Nreads | Zeropoints | Mag plots | Spatial mag deviation | Spatial sky 16325A emission deviations (filled: sky, open: star) | Spatial sky continuum emission | Spatial sky telluric CO2 absorption deviations (filled: H < 10) | |||||||||||||||||||||||
| 0 | 0 |
|
|
|
|
|
|
| IPAIR | NAME | SHIFT | NEWSHIFT | S/N | NAME | SHIFT | NEWSHIFT | S/N |
| 0 | 06950106 | 0.495970 | 0.00000 | 17.9570 | 06950105 | -0.000879685 | 0.496850 | 17.8330 |
| 1 | 06950098 | 0.494608 | 0.00136200 | 19.2015 | 06950097 | 0.00000 | 0.495970 | 19.1954 |
| 2 | 06950099 | 0.494972 | 0.000998020 | 19.2004 | 06950100 | 0.00121175 | 0.494758 | 19.1840 |
| 3 | 06950102 | 0.494553 | 0.00141701 | 19.1764 | 06950101 | -0.00246420 | 0.498434 | 19.1695 |
| 4 | 06950103 | 0.494762 | 0.00120801 | 18.8004 | 06950104 | -0.000788894 | 0.496759 | 18.4131 |