| Red | Green | Blue | |
| z | 17.64 | ||
| znorm | Inf | ||
| sky | -Inf | -Inf | -Inf |
| S/N | 24.5 | 41.0 | 42.9 |
| S/N(c) | 0.0 | 0.0 | 0.0 |
| SN(E/C) |
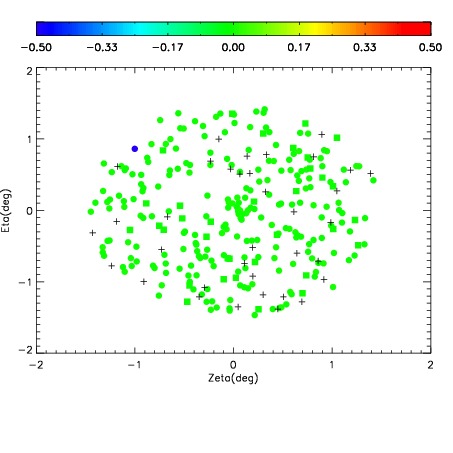

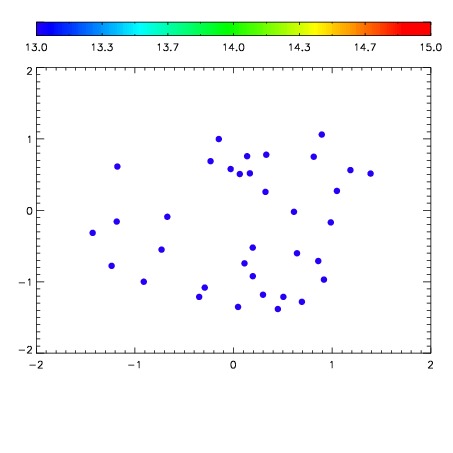

| Frame | Nreads | Zeropoints | Mag plots | Spatial mag deviation | Spatial sky 16325A emission deviations (filled: sky, open: star) | Spatial sky continuum emission | Spatial sky telluric CO2 absorption deviations (filled: H < 10) | |||||||||||||||||||||||
| 0 | 0 |
|
|
|
|
|
|
| IPAIR | NAME | SHIFT | NEWSHIFT | S/N | NAME | SHIFT | NEWSHIFT | S/N |
| 0 | 04030053 | 0.502207 | 0.00000 | 19.1270 | 04030054 | 0.00262418 | 0.499583 | 19.1471 |
| 1 | 04030052 | 0.500781 | 0.00142598 | 19.1293 | 04030051 | 0.00000 | 0.502207 | 19.1918 |
| 2 | 04030056 | 0.501655 | 0.000551999 | 18.8318 | 04030055 | 0.000570193 | 0.501637 | 19.0655 |
| 3 | 04030057 | 0.501833 | 0.000373960 | 18.7938 | 04030058 | 0.000905472 | 0.501302 | 18.5026 |