| Red | Green | Blue | |
| z | 17.64 | ||
| znorm | Inf | ||
| sky | -Inf | -Inf | -Inf |
| S/N | 14.8 | 27.1 | 30.3 |
| S/N(c) | 0.0 | 0.0 | 0.0 |
| SN(E/C) |
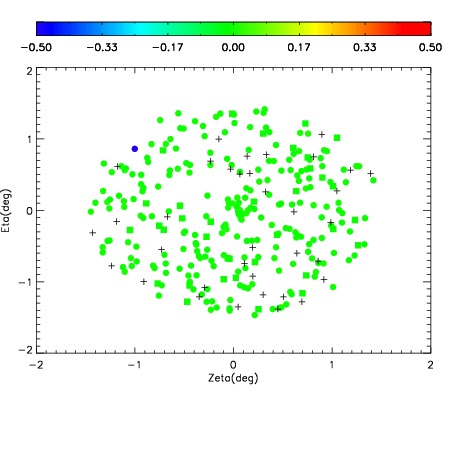
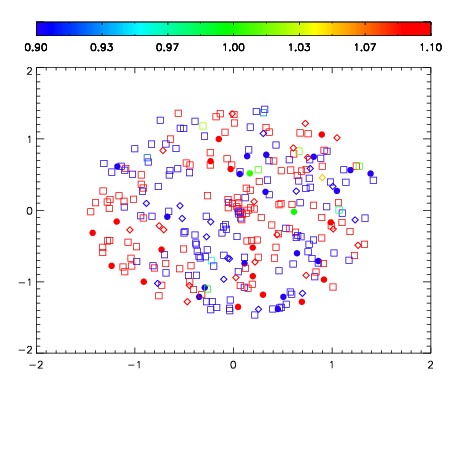
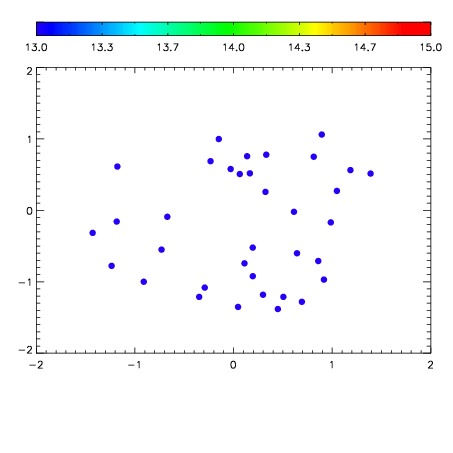

| Frame | Nreads | Zeropoints | Mag plots | Spatial mag deviation | Spatial sky 16325A emission deviations (filled: sky, open: star) | Spatial sky continuum emission | Spatial sky telluric CO2 absorption deviations (filled: H < 10) | |||||||||||||||||||||||
| 0 | 0 |
|
|
|
|
|
|
| IPAIR | NAME | SHIFT | NEWSHIFT | S/N | NAME | SHIFT | NEWSHIFT | S/N |
| 0 | 04600016 | 0.501794 | 0.00000 | 18.4949 | 04600017 | 0.00241427 | 0.499380 | 18.6904 |
| 1 | 04600015 | 0.499815 | 0.00197899 | 18.3983 | 04600010 | 0.00000 | 0.501794 | 18.4417 |
| 2 | 04600011 | 0.500359 | 0.00143498 | 18.3854 | 04600013 | 0.00130294 | 0.500491 | 18.3605 |
| 3 | 04600012 | 0.501254 | 0.000539958 | 18.3184 | 04600014 | 0.00165125 | 0.500143 | 18.2120 |