| Red | Green | Blue | |
| z | 17.64 | ||
| znorm | Inf | ||
| sky | -Inf | -Inf | -Inf |
| S/N | 16.5 | 31.7 | 33.9 |
| S/N(c) | 0.0 | 0.0 | 0.0 |
| SN(E/C) |
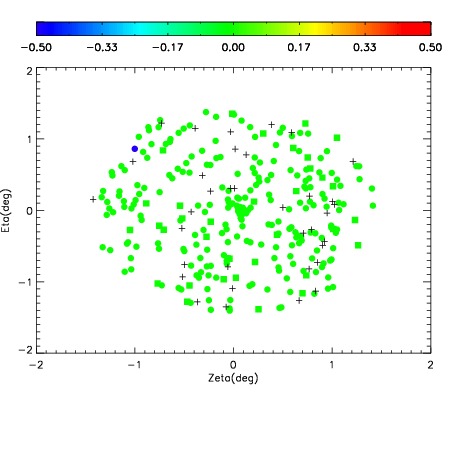
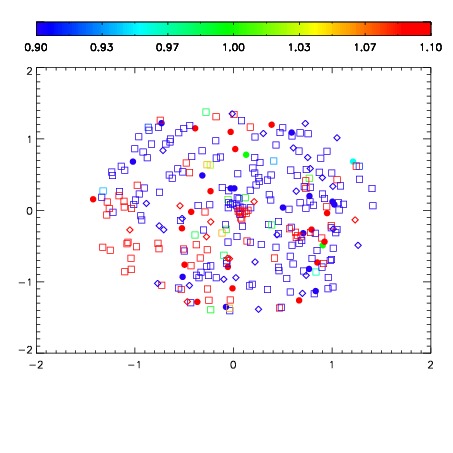
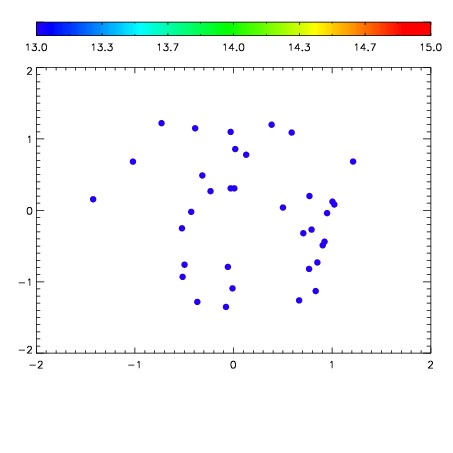

| Frame | Nreads | Zeropoints | Mag plots | Spatial mag deviation | Spatial sky 16325A emission deviations (filled: sky, open: star) | Spatial sky continuum emission | Spatial sky telluric CO2 absorption deviations (filled: H < 10) | |||||||||||||||||||||||
| 0 | 0 |
|
|
|
|
|
|
| IPAIR | NAME | SHIFT | NEWSHIFT | S/N | NAME | SHIFT | NEWSHIFT | S/N |
| 0 | 04070012 | 0.503709 | 0.00000 | 18.5307 | 04070018 | 0.00238514 | 0.501324 | 18.1193 |
| 1 | 04070020 | 0.501522 | 0.00218701 | 18.7778 | 04070021 | 0.00412367 | 0.499585 | 18.9189 |
| 2 | 04070019 | 0.502403 | 0.00130600 | 18.2818 | 04070014 | 0.00338523 | 0.500324 | 17.7655 |
| 3 | 04070016 | 0.502832 | 0.000877023 | 18.2617 | 04070013 | 0.00421572 | 0.499493 | 17.6702 |
| 4 | 04070011 | 0.502807 | 0.000901997 | 18.1309 | 04070017 | 0.00516720 | 0.498542 | 17.5297 |
| 5 | 04070015 | 0.502408 | 0.00130099 | 17.8999 | 04070010 | 0.00000 | 0.503709 | 17.1683 |