| Red | Green | Blue | |
| z | 17.64 | ||
| znorm | Inf | ||
| sky | -Inf | -Inf | -Inf |
| S/N | 33.8 | 56.8 | 63.2 |
| S/N(c) | 0.0 | 0.0 | 0.0 |
| SN(E/C) |
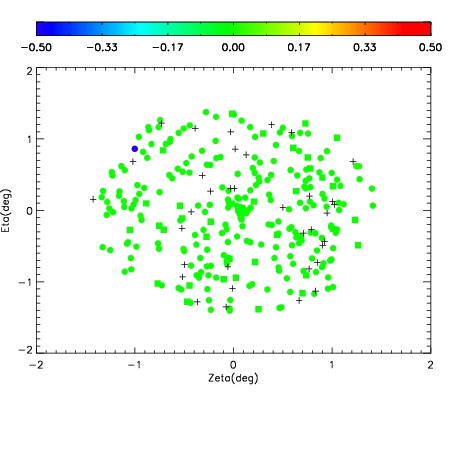
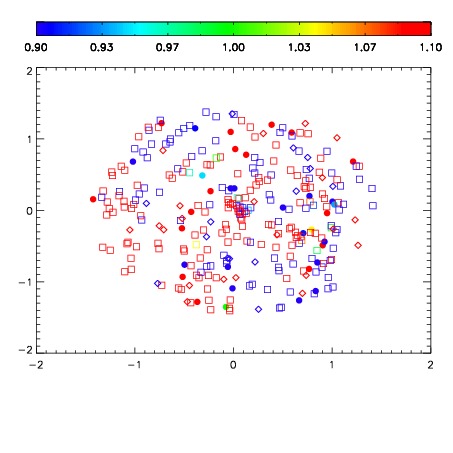
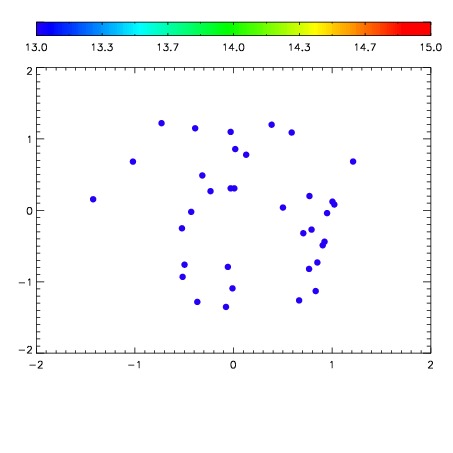

| Frame | Nreads | Zeropoints | Mag plots | Spatial mag deviation | Spatial sky 16325A emission deviations (filled: sky, open: star) | Spatial sky continuum emission | Spatial sky telluric CO2 absorption deviations (filled: H < 10) | |||||||||||||||||||||||
| 0 | 0 |
|
|
|
|
|
|
| IPAIR | NAME | SHIFT | NEWSHIFT | S/N | NAME | SHIFT | NEWSHIFT | S/N |
| 0 | 06940099 | 0.500464 | 0.00000 | 19.1552 | 06940102 | 0.000882674 | 0.499581 | 19.1541 |
| 1 | 06940108 | 0.497602 | 0.00286204 | 19.1883 | 06940109 | 0.00254263 | 0.497921 | 19.1841 |
| 2 | 06940107 | 0.497171 | 0.00329301 | 19.1824 | 06940106 | -0.000466474 | 0.500930 | 19.1818 |
| 3 | 06940104 | 0.497950 | 0.00251403 | 19.1683 | 06940105 | 0.000713824 | 0.499750 | 19.1780 |
| 4 | 06940103 | 0.497802 | 0.00266203 | 19.1649 | 06940098 | 0.00000 | 0.500464 | 19.1619 |
| 5 | 06940100 | 0.500396 | 6.80089e-05 | 19.1493 | 06940101 | 0.00436906 | 0.496095 | 19.1348 |