| Red | Green | Blue | |
| z | 17.64 | ||
| znorm | Inf | ||
| sky | -Inf | -NaN | -Inf |
| S/N | 24.9 | 46.5 | 50.3 |
| S/N(c) | 0.0 | 0.0 | 0.0 |
| SN(E/C) |

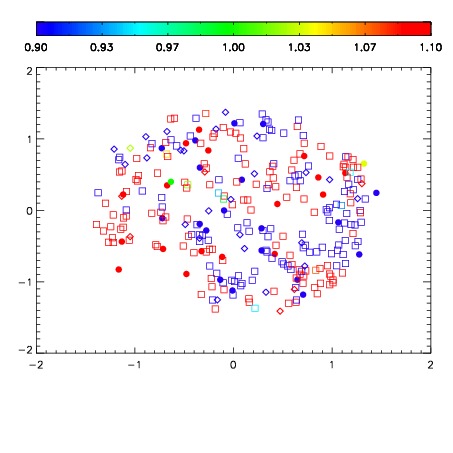


| Frame | Nreads | Zeropoints | Mag plots | Spatial mag deviation | Spatial sky 16325A emission deviations (filled: sky, open: star) | Spatial sky continuum emission | Spatial sky telluric CO2 absorption deviations (filled: H < 10) | |||||||||||||||||||||||
| 0 | 0 |
|
|
|
|
|
|
| IPAIR | NAME | SHIFT | NEWSHIFT | S/N | NAME | SHIFT | NEWSHIFT | S/N |
| 0 | 03690086 | 0.497677 | 0.00000 | 18.8283 | 03690087 | -0.00303463 | 0.500712 | 18.8792 |
| 1 | 03690090 | 0.496730 | 0.000946999 | 18.8876 | 03690091 | 0.000326612 | 0.497350 | 18.9923 |
| 2 | 03690089 | 0.494880 | 0.00279701 | 18.8266 | 03690088 | -0.00260030 | 0.500277 | 18.8698 |
| 3 | 03690085 | 0.495904 | 0.00177300 | 18.6926 | 03690084 | -0.00445696 | 0.502134 | 18.4193 |
| 4 | 03690082 | 0.495128 | 0.00254899 | 18.2677 | 03690083 | -0.00192628 | 0.499603 | 18.3980 |
| 5 | 03690081 | 0.493491 | 0.00418600 | 18.2446 | 03690080 | 0.00000 | 0.497677 | 18.2521 |