| Red | Green | Blue | |
| z | 17.64 | ||
| znorm | Inf | ||
| sky | -NaN | -NaN | -Inf |
| S/N | 24.6 | 43.9 | 45.8 |
| S/N(c) | 0.0 | 0.0 | 0.0 |
| SN(E/C) |
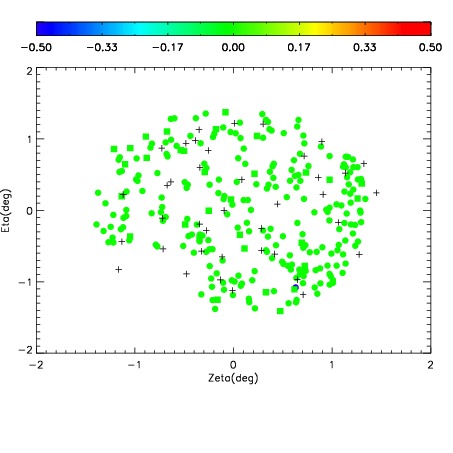
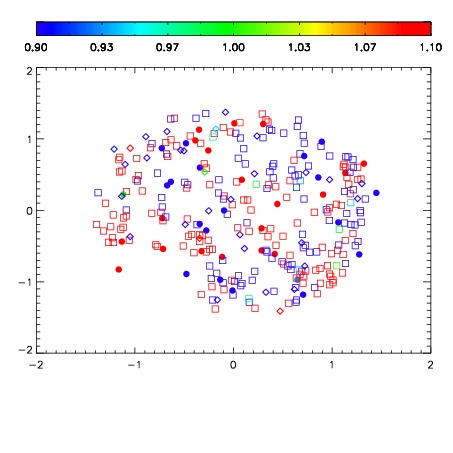


| Frame | Nreads | Zeropoints | Mag plots | Spatial mag deviation | Spatial sky 16325A emission deviations (filled: sky, open: star) | Spatial sky continuum emission | Spatial sky telluric CO2 absorption deviations (filled: H < 10) | |||||||||||||||||||||||
| 0 | 0 |
|
|
|
|
|
|
| IPAIR | NAME | SHIFT | NEWSHIFT | S/N | NAME | SHIFT | NEWSHIFT | S/N |
| 0 | 03970066 | 0.500036 | 0.00000 | 18.9810 | 03970064 | 0.00183350 | 0.498203 | 19.0065 |
| 1 | 03970062 | 0.497035 | 0.00300100 | 18.9616 | 03970063 | 0.00125583 | 0.498780 | 18.9844 |
| 2 | 03970061 | 0.495961 | 0.00407499 | 18.9075 | 03970060 | 0.00000 | 0.500036 | 18.9514 |
| 3 | 03970065 | 0.499863 | 0.000173002 | 18.8420 | 03970067 | 0.000478362 | 0.499558 | 18.9131 |