| Red | Green | Blue | |
| z | 17.64 | ||
| znorm | Inf | ||
| sky | -NaN | -NaN | -NaN |
| S/N | 22.4 | 41.1 | 43.2 |
| S/N(c) | 0.0 | 0.0 | 0.0 |
| SN(E/C) |
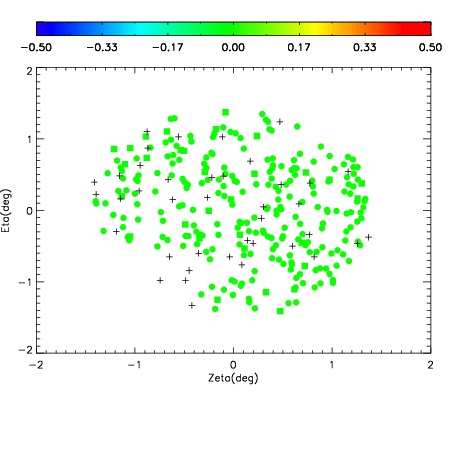
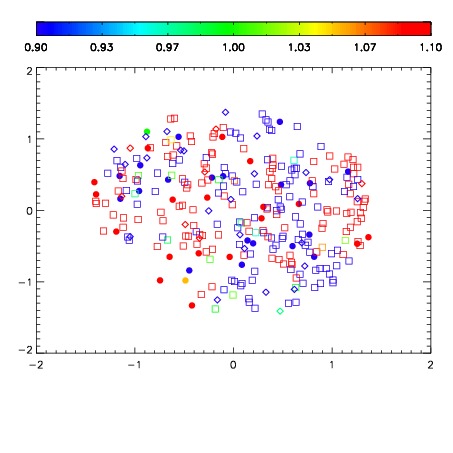
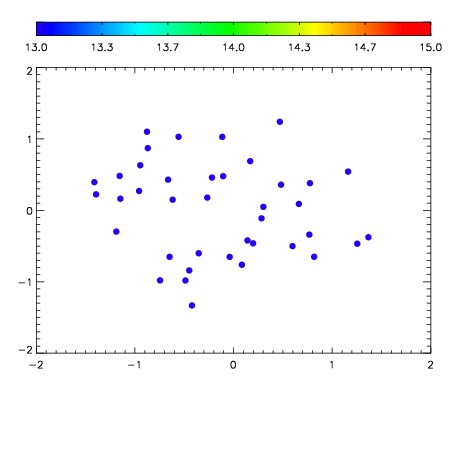

| Frame | Nreads | Zeropoints | Mag plots | Spatial mag deviation | Spatial sky 16325A emission deviations (filled: sky, open: star) | Spatial sky continuum emission | Spatial sky telluric CO2 absorption deviations (filled: H < 10) | |||||||||||||||||||||||
| 0 | 0 |
|
|
|
|
|
|
| IPAIR | NAME | SHIFT | NEWSHIFT | S/N | NAME | SHIFT | NEWSHIFT | S/N |
| 0 | 03740040 | 0.502228 | 0.00000 | 18.9794 | 03740041 | 0.00475626 | 0.497472 | 18.8818 |
| 1 | 03740039 | 0.500167 | 0.00206101 | 18.9212 | 03740038 | 0.00290013 | 0.499328 | 18.8643 |
| 2 | 03740036 | 0.498882 | 0.00334603 | 18.6660 | 03740037 | 0.00258912 | 0.499639 | 18.7976 |
| 3 | 03740035 | 0.497235 | 0.00499302 | 18.5734 | 03740034 | 0.00000 | 0.502228 | 18.5083 |