| Red | Green | Blue | |
| z | 17.65 | ||
| znorm | Inf | ||
| sky | -Inf | -NaN | -Inf |
| S/N | 5.3 | 9.8 | 10.9 |
| S/N(c) | 0.0 | 0.0 | 0.0 |
| SN(E/C) |
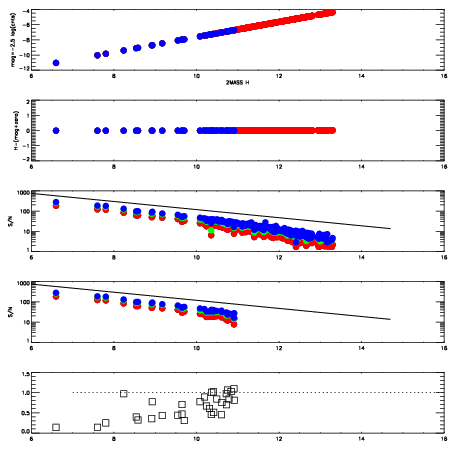
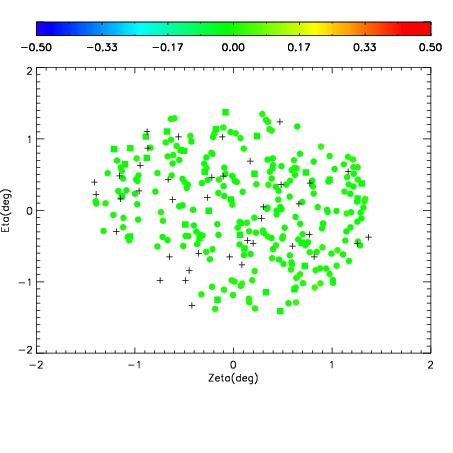
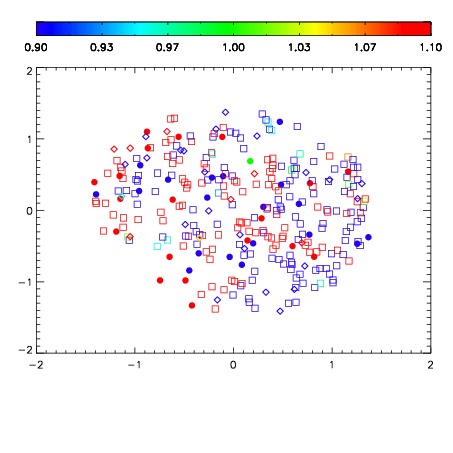
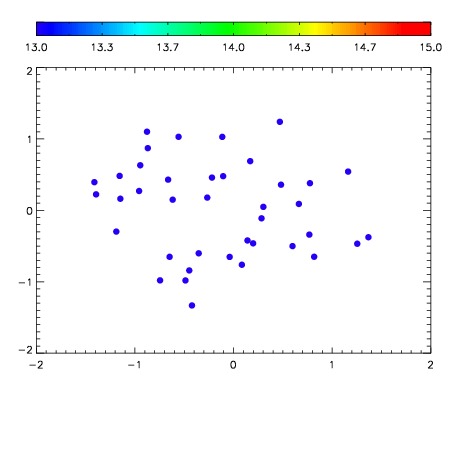

| Frame | Nreads | Zeropoints | Mag plots | Spatial mag deviation | Spatial sky 16325A emission deviations (filled: sky, open: star) | Spatial sky continuum emission | Spatial sky telluric CO2 absorption deviations (filled: H < 10) | |||||||||||||||||||||||
| 0 | 0 |
|
|
|
|
|
|
| IPAIR | NAME | SHIFT | NEWSHIFT | S/N | NAME | SHIFT | NEWSHIFT | S/N |
| 0 | 04020026 | 0.503212 | 0.00000 | 16.7364 | 04020028 | 0.00140446 | 0.501808 | 17.3899 |
| 1 | 04020025 | 0.499663 | 0.00354898 | 17.1101 | 04020024 | 0.00000 | 0.503212 | 17.7395 |
| 2 | 04020029 | 0.501074 | 0.00213796 | 17.0865 | 04020027 | 0.00221190 | 0.501000 | 17.6274 |
| 3 | 04020030 | 0.502549 | 0.000662982 | 15.7218 | 04020031 | 0.00287858 | 0.500333 | 15.8297 |