| Red | Green | Blue | |
| z | 17.64 | ||
| znorm | Inf | ||
| sky | -NaN | -Inf | -Inf |
| S/N | 34.2 | 61.6 | 66.9 |
| S/N(c) | 0.0 | 0.0 | 0.0 |
| SN(E/C) |
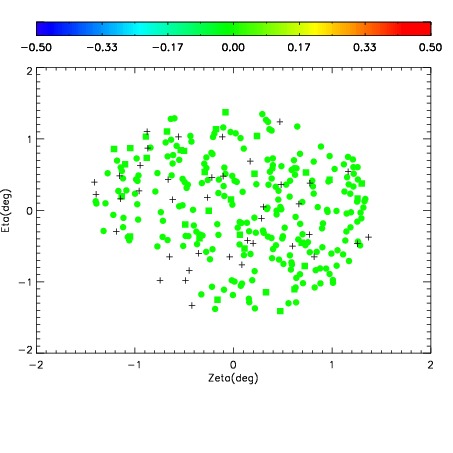
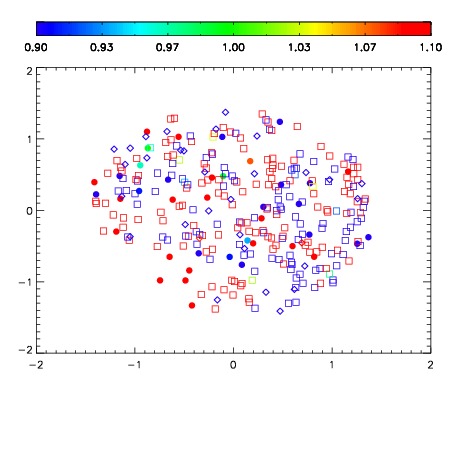
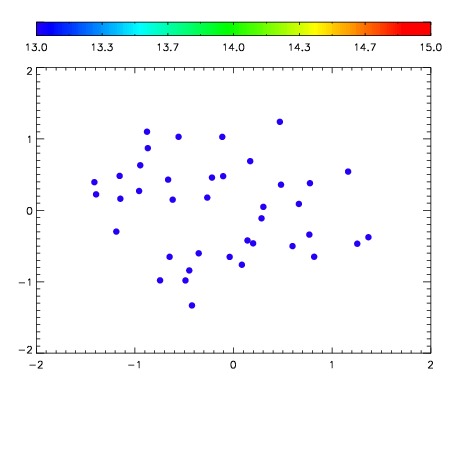

| Frame | Nreads | Zeropoints | Mag plots | Spatial mag deviation | Spatial sky 16325A emission deviations (filled: sky, open: star) | Spatial sky continuum emission | Spatial sky telluric CO2 absorption deviations (filled: H < 10) | |||||||||||||||||||||||
| 0 | 0 |
|
|
|
|
|
|
| IPAIR | NAME | SHIFT | NEWSHIFT | S/N | NAME | SHIFT | NEWSHIFT | S/N |
| 0 | 04030079 | 0.504719 | 0.00000 | 19.1172 | 04030080 | 0.00463587 | 0.500083 | 19.1285 |
| 1 | 04030083 | 0.502904 | 0.00181502 | 19.2151 | 04030081 | 0.00283909 | 0.501880 | 19.1843 |
| 2 | 04030082 | 0.501089 | 0.00363004 | 19.1777 | 04030084 | 0.00566474 | 0.499054 | 19.1735 |
| 3 | 04030078 | 0.502902 | 0.00181705 | 19.1007 | 04030077 | 0.000685709 | 0.504033 | 19.0622 |
| 4 | 04030074 | 0.500364 | 0.00435501 | 19.0102 | 04030073 | 0.00000 | 0.504719 | 19.0527 |
| 5 | 04030075 | 0.501248 | 0.00347102 | 18.9689 | 04030076 | 0.000700975 | 0.504018 | 19.0362 |