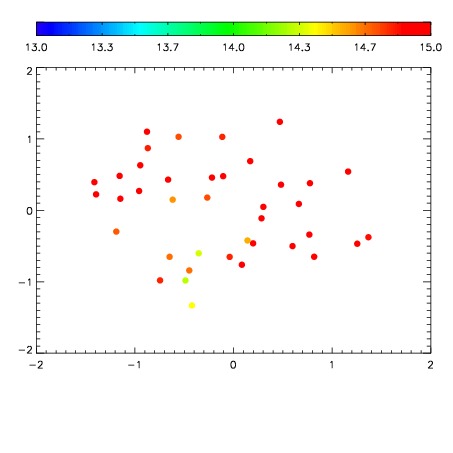
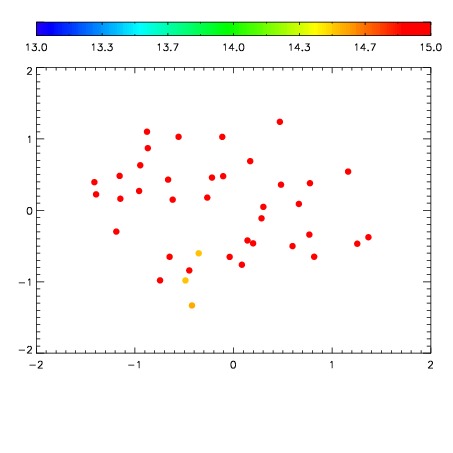
| Frame | Nreads | Zeropoints | Mag plots
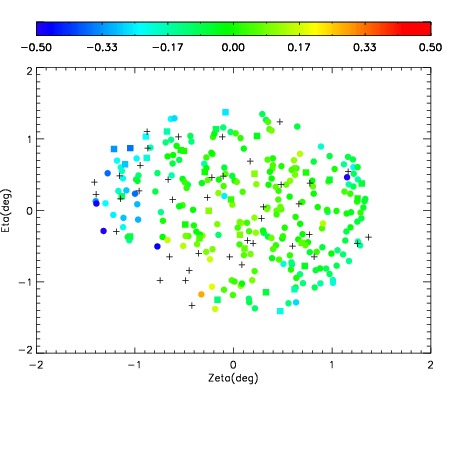
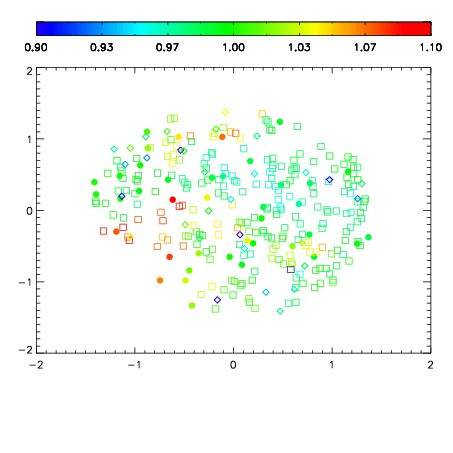
| Spatial mag deviation
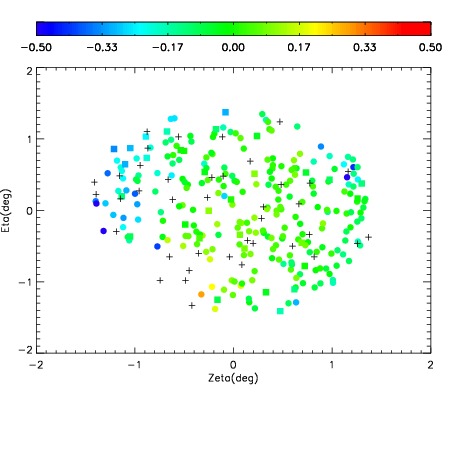
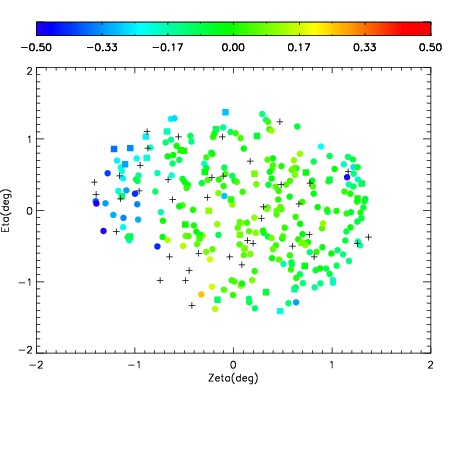
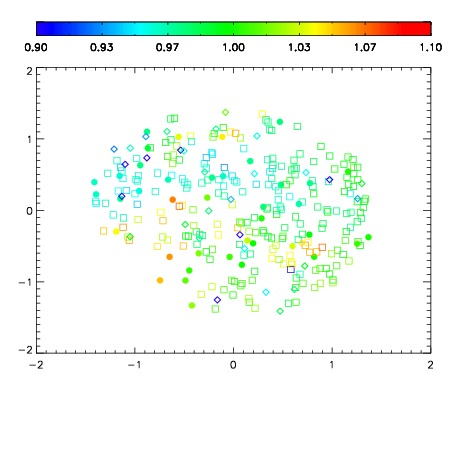
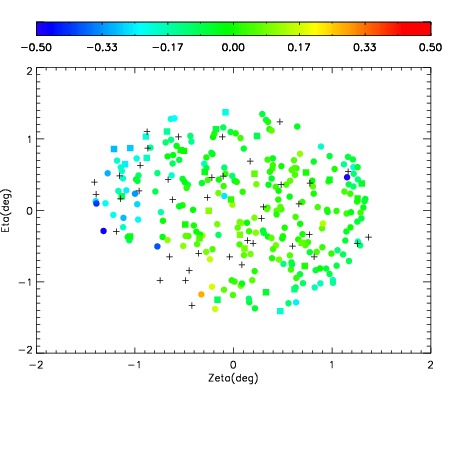
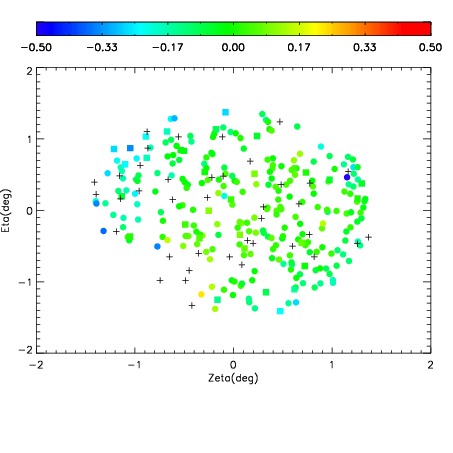
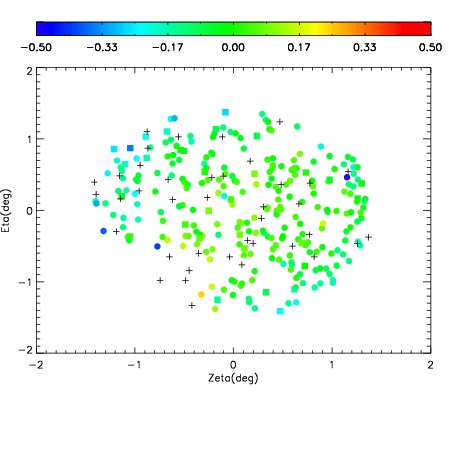
| Spatial sky 16325A emission deviations (filled: sky, open: star)
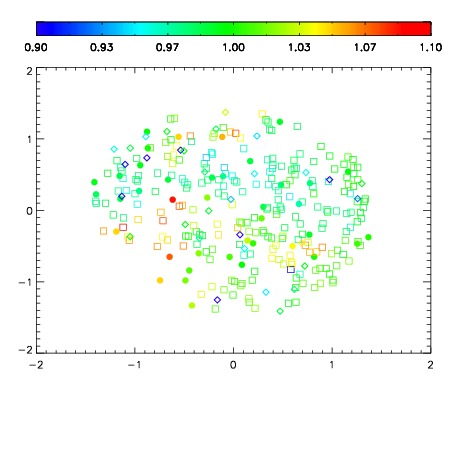
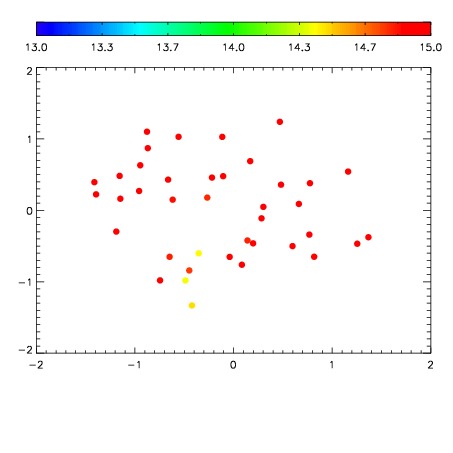
| Spatial sky continuum emission
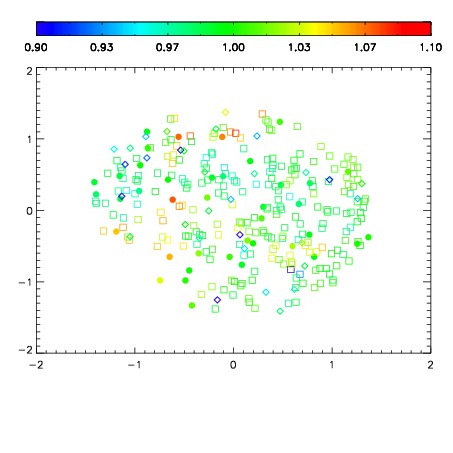
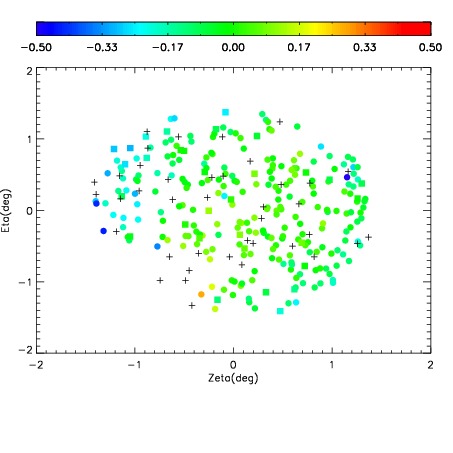
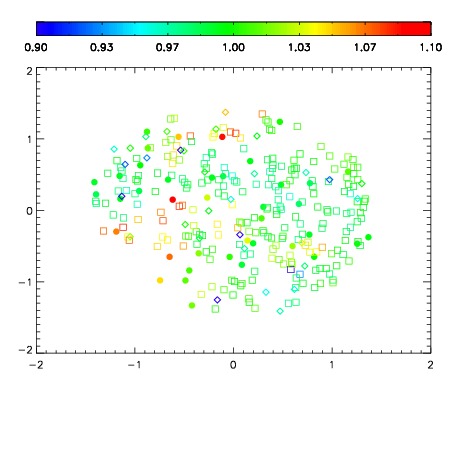
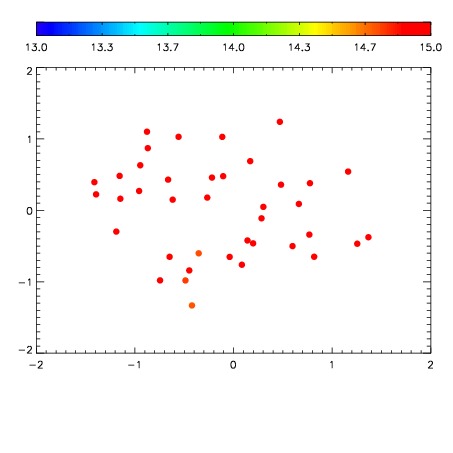
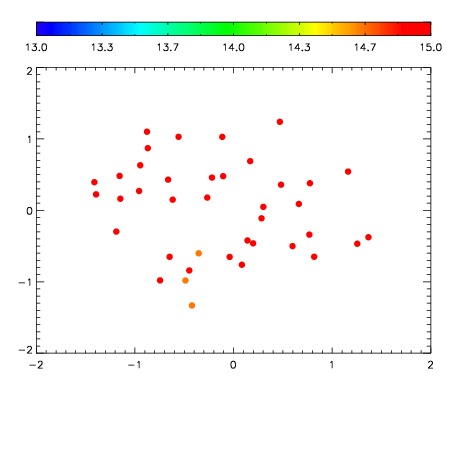
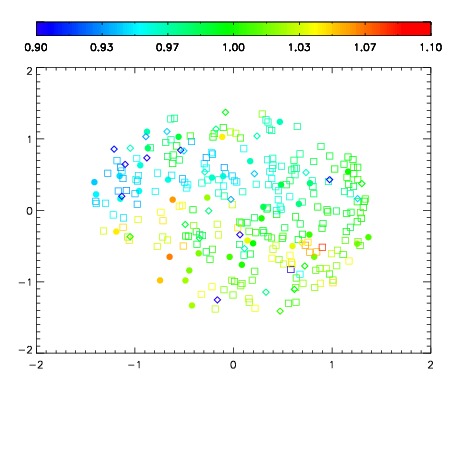
| Spatial sky telluric CO2 absorption deviations (filled: H < 10)
|
| 4270032
| 47
| | Red | Green | Blue
| | z | | 18.74
| | znorm | | 14.56
| | sky | 15.0 | 14.9 | 14.9
| | S/N | 12.2 | 21.1 | 22.1
| | S/N(c) | 4.8 | 13.2 | 14.7
| | SN(E/C) 0.34
|
| 
| 
| 
| 
| 
|
| 4270033
| 47
| | Red | Green | Blue
| | z | | 18.82
| | znorm | | 14.64
| | sky | 15.4 | 15.0 | 15.4
| | S/N | 12.8 | 21.8 | 22.9
| | S/N(c) | 5.0 | 13.8 | 15.6
| | SN(E/C) 0.30
|
| 
| 
| 
| 
| 
|
| 4270034
| 47
| | Red | Green | Blue
| | z | | 18.78
| | znorm | | 14.60
| | sky | 15.1 | 15.1 | 15.4
| | S/N | 12.7 | 21.6 | 22.7
| | S/N(c) | 4.9 | 13.7 | 15.4
| | SN(E/C) 0.29
|
| 
| 
| 
| 
| 
|
| 4270035
| 47
| | Red | Green | Blue
| | z | | 18.62
| | znorm | | 14.44
| | sky | 15.3 | 15.1 | 15.4
| | S/N | 11.4 | 20.1 | 20.4
| | S/N(c) | 4.4 | 12.5 | 14.0
| | SN(E/C) 0.33
|
| 
| 
| 
| 
| 
|
| 4270036
| 47
| | Red | Green | Blue
| | z | | 18.57
| | znorm | | 14.39
| | sky | 15.5 | 15.1 | 15.5
| | S/N | 10.9 | 19.6 | 19.7
| | S/N(c) | 4.2 | 12.1 | 13.7
| | SN(E/C) 0.34
|
| 
| 
| 
| 
| 
|
| 4270037
| 47
| | Red | Green | Blue
| | z | | 18.65
| | znorm | | 14.47
| | sky | 15.9 | 15.3 | 15.3
| | S/N | 11.5 | 20.4 | 20.9
| | S/N(c) | 4.5 | 12.7 | 14.4
| | SN(E/C) 0.33
|
| 
| 
| 
| 
| 
|
| 4270038
| 47
| | Red | Green | Blue
| | z | | 18.62
| | znorm | | 14.44
| | sky | 15.3 | 15.2 | 15.2
| | S/N | 11.2 | 20.2 | 20.8
| | S/N(c) | 4.4 | 12.7 | 14.1
| | SN(E/C) 0.34
|
| 
| 
| 
| 
| 
|
| 4270039
| 47
| | Red | Green | Blue
| | z | | 18.62
| | znorm | | 14.44
| | sky | 15.2 | 15.3 | 15.3
| | S/N | 11.3 | 20.3 | 21.0
| | S/N(c) | 4.4 | 12.6 | 14.2
| | SN(E/C) 0.33
|
| 
| 
| 
| 
| 
|