| Red | Green | Blue | |
| z | 17.64 | ||
| znorm | Inf | ||
| sky | -NaN | -Inf | -Inf |
| S/N | 27.7 | 47.6 | 52.2 |
| S/N(c) | 0.0 | 0.0 | 0.0 |
| SN(E/C) |
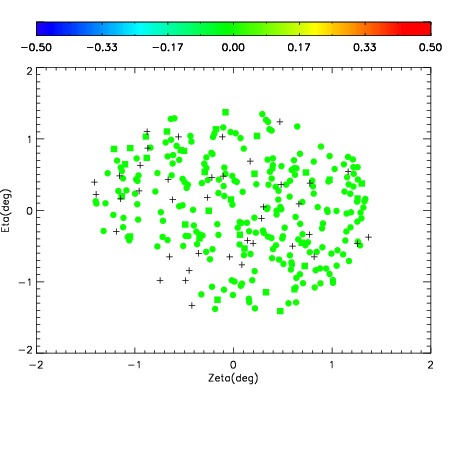
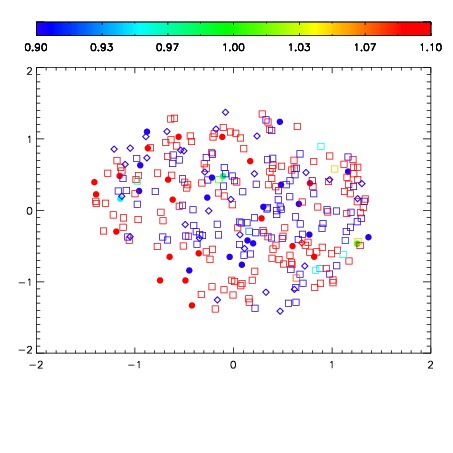


| Frame | Nreads | Zeropoints | Mag plots | Spatial mag deviation | Spatial sky 16325A emission deviations (filled: sky, open: star) | Spatial sky continuum emission | Spatial sky telluric CO2 absorption deviations (filled: H < 10) | |||||||||||||||||||||||
| 0 | 0 |
|
|
|
|
|
|
| IPAIR | NAME | SHIFT | NEWSHIFT | S/N | NAME | SHIFT | NEWSHIFT | S/N |
| 0 | 04280054 | 0.497250 | 0.00000 | 18.9804 | 04280055 | 0.00177114 | 0.495479 | 18.9912 |
| 1 | 04280058 | 0.494965 | 0.00228500 | 19.1573 | 04280059 | 0.00223364 | 0.495016 | 19.1616 |
| 2 | 04280053 | 0.493870 | 0.00338000 | 19.1041 | 04280056 | 0.000815199 | 0.496435 | 19.0712 |
| 3 | 04280057 | 0.494101 | 0.00314900 | 19.0975 | 04280052 | 0.00000 | 0.497250 | 19.0484 |