| Red | Green | Blue | |
| z | 17.64 | ||
| znorm | Inf | ||
| sky | -Inf | -Inf | -Inf |
| S/N | 25.9 | 45.1 | 49.5 |
| S/N(c) | 0.0 | 0.0 | 0.0 |
| SN(E/C) |

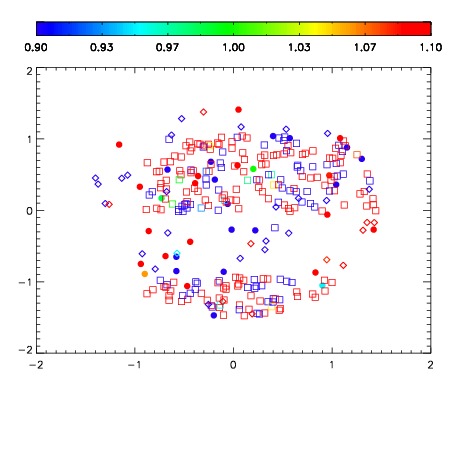
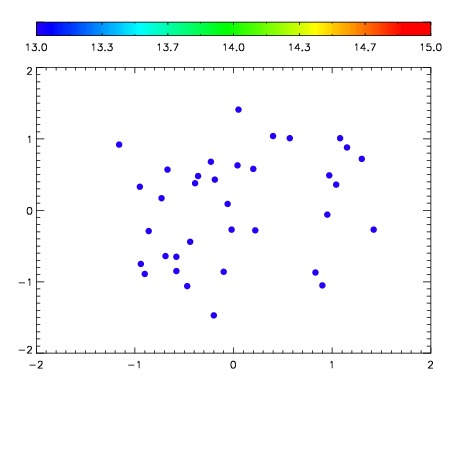

| Frame | Nreads | Zeropoints | Mag plots | Spatial mag deviation | Spatial sky 16325A emission deviations (filled: sky, open: star) | Spatial sky continuum emission | Spatial sky telluric CO2 absorption deviations (filled: H < 10) | |||||||||||||||||||||||
| 0 | 0 |
|
|
|
|
|
|
| IPAIR | NAME | SHIFT | NEWSHIFT | S/N | NAME | SHIFT | NEWSHIFT | S/N |
| 0 | 03980069 | 0.497409 | 0.00000 | 18.7913 | 03980070 | 0.00200286 | 0.495406 | 18.7299 |
| 1 | 03980068 | 0.497053 | 0.000355989 | 18.9368 | 03980074 | 0.00317896 | 0.494230 | 18.9279 |
| 2 | 03980072 | 0.495041 | 0.00236797 | 18.8820 | 03980071 | 0.000225240 | 0.497184 | 18.9023 |
| 3 | 03980073 | 0.496704 | 0.000704974 | 18.8308 | 03980067 | 0.00000 | 0.497409 | 18.8564 |