| Red | Green | Blue | |
| z | 17.64 | ||
| znorm | Inf | ||
| sky | -Inf | -Inf | -Inf |
| S/N | 27.9 | 48.1 | 51.2 |
| S/N(c) | 0.0 | 0.0 | 0.0 |
| SN(E/C) |
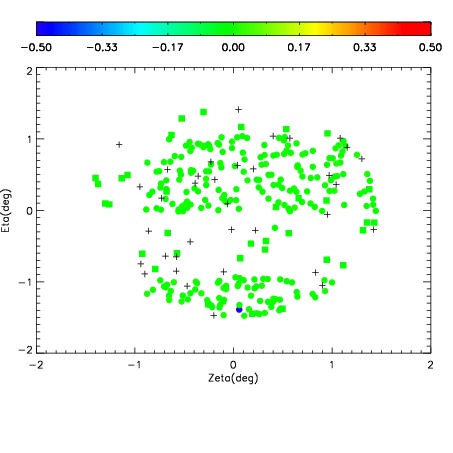
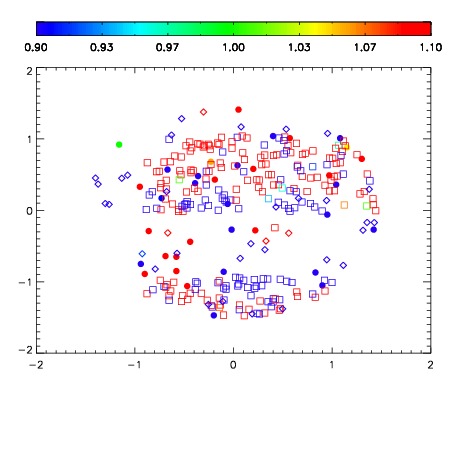
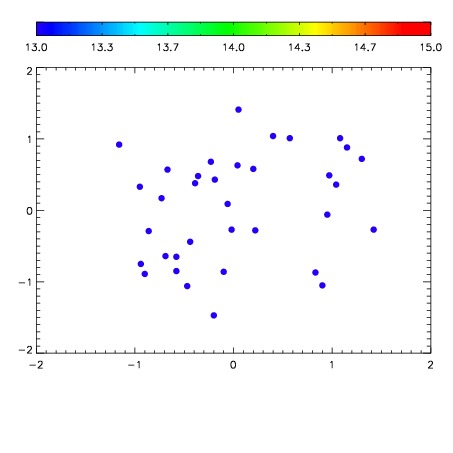

| Frame | Nreads | Zeropoints | Mag plots | Spatial mag deviation | Spatial sky 16325A emission deviations (filled: sky, open: star) | Spatial sky continuum emission | Spatial sky telluric CO2 absorption deviations (filled: H < 10) | |||||||||||||||||||||||
| 0 | 0 |
|
|
|
|
|
|
| IPAIR | NAME | SHIFT | NEWSHIFT | S/N | NAME | SHIFT | NEWSHIFT | S/N |
| 0 | 04280069 | 0.500398 | 0.00000 | 18.7737 | 04280067 | 0.00169268 | 0.498705 | 18.8540 |
| 1 | 04280065 | 0.493781 | 0.00661698 | 19.0718 | 04280066 | 0.00175555 | 0.498642 | 19.0809 |
| 2 | 04280064 | 0.490431 | 0.00996697 | 19.0007 | 04280063 | 0.00000 | 0.500398 | 19.0238 |
| 3 | 04280068 | 0.493011 | 0.00738698 | 18.7512 | 04280070 | 0.00307243 | 0.497326 | 18.6179 |