| Red | Green | Blue | |
| z | 17.64 | ||
| znorm | Inf | ||
| sky | -NaN | -NaN | -NaN |
| S/N | 26.1 | 45.0 | 47.1 |
| S/N(c) | 0.0 | 0.0 | 0.0 |
| SN(E/C) |
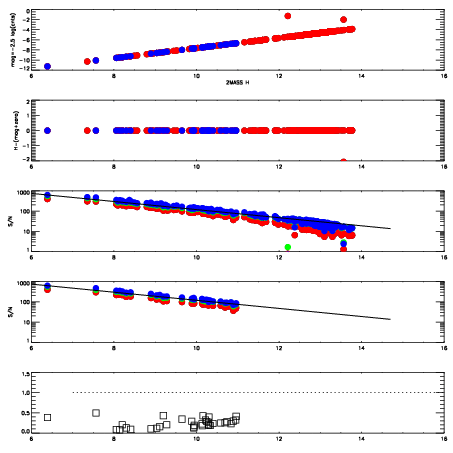
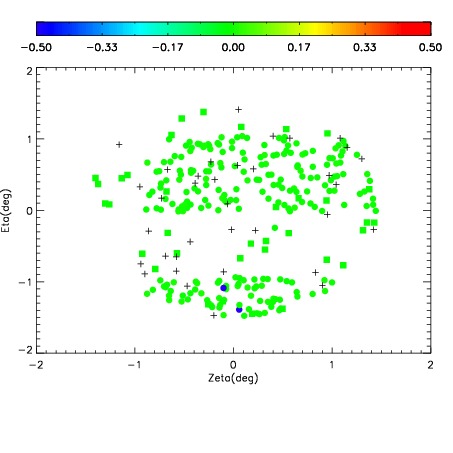
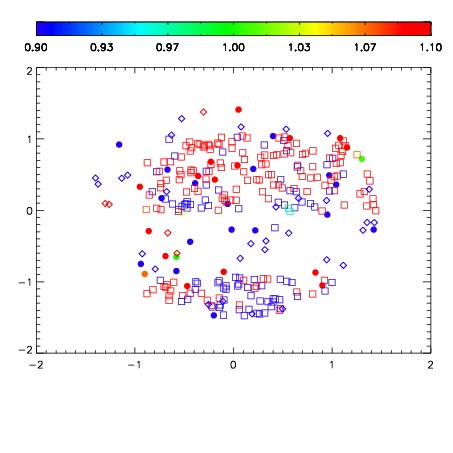
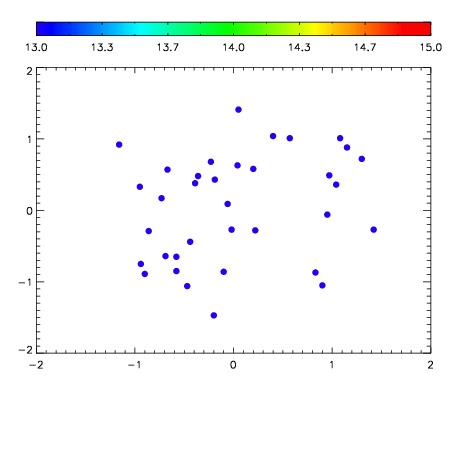

| Frame | Nreads | Zeropoints | Mag plots | Spatial mag deviation | Spatial sky 16325A emission deviations (filled: sky, open: star) | Spatial sky continuum emission | Spatial sky telluric CO2 absorption deviations (filled: H < 10) | |||||||||||||||||||||||
| 0 | 0 |
|
|
|
|
|
|
| IPAIR | NAME | SHIFT | NEWSHIFT | S/N | NAME | SHIFT | NEWSHIFT | S/N |
| 0 | 04360027 | 0.493882 | 0.00000 | 18.9372 | 04360028 | -0.000851927 | 0.494734 | 18.9697 |
| 1 | 04360026 | 0.486793 | 0.00708899 | 18.9221 | 04360021 | 0.00000 | 0.493882 | 18.7972 |
| 2 | 04360023 | 0.490604 | 0.00327799 | 18.8692 | 04360025 | -0.00315336 | 0.497035 | 18.6351 |
| 3 | 04360022 | 0.488320 | 0.00556201 | 18.7324 | 04360024 | 0.00143711 | 0.492445 | 18.6346 |