| Red | Green | Blue | |
| z | 17.64 | ||
| znorm | Inf | ||
| sky | -Inf | -Inf | -Inf |
| S/N | 26.0 | 45.6 | 48.5 |
| S/N(c) | 0.0 | 0.0 | 0.0 |
| SN(E/C) |
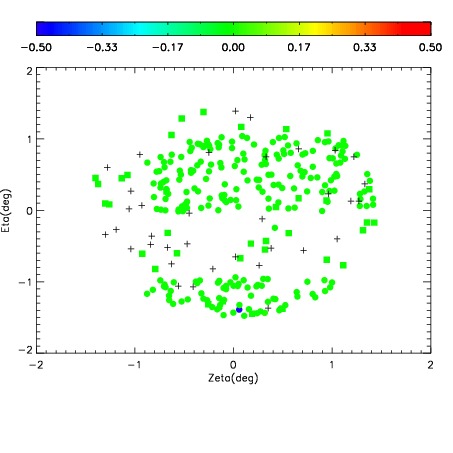
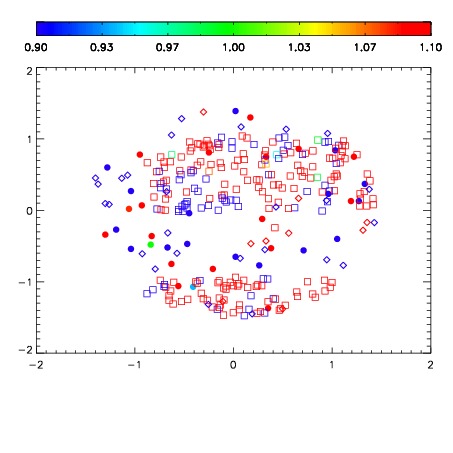


| Frame | Nreads | Zeropoints | Mag plots | Spatial mag deviation | Spatial sky 16325A emission deviations (filled: sky, open: star) | Spatial sky continuum emission | Spatial sky telluric CO2 absorption deviations (filled: H < 10) | |||||||||||||||||||||||
| 0 | 0 |
|
|
|
|
|
|
| IPAIR | NAME | SHIFT | NEWSHIFT | S/N | NAME | SHIFT | NEWSHIFT | S/N |
| 0 | 07520084 | 0.472813 | 0.00000 | 19.0344 | 07520085 | 0.00618515 | 0.466628 | 19.0063 |
| 1 | 07520080 | 0.471764 | 0.00104901 | 19.0085 | 07520082 | 0.00283857 | 0.469974 | 18.9817 |
| 2 | 07520083 | 0.472772 | 4.10080e-05 | 18.9949 | 07520078 | 0.00000 | 0.472813 | 18.9588 |
| 3 | 07520079 | 0.470844 | 0.00196901 | 18.9566 | 07520081 | 0.00334199 | 0.469471 | 18.9185 |