| Red | Green | Blue | |
| z | 17.64 | ||
| znorm | Inf | ||
| sky | -Inf | -Inf | -Inf |
| S/N | 25.7 | 46.5 | 51.0 |
| S/N(c) | 0.0 | 0.0 | 0.0 |
| SN(E/C) |
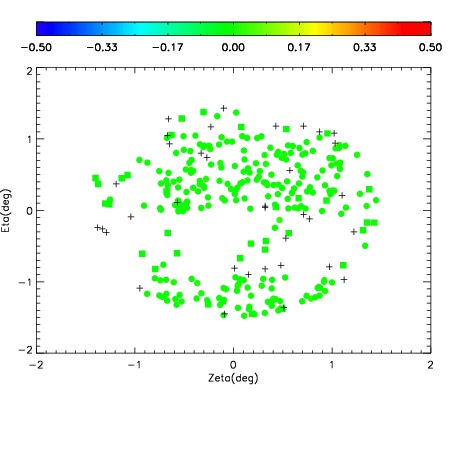
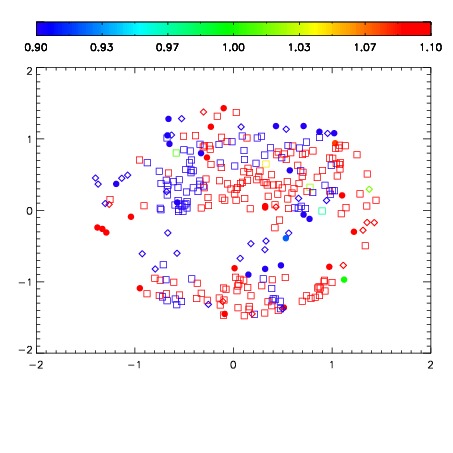


| Frame | Nreads | Zeropoints | Mag plots | Spatial mag deviation | Spatial sky 16325A emission deviations (filled: sky, open: star) | Spatial sky continuum emission | Spatial sky telluric CO2 absorption deviations (filled: H < 10) | |||||||||||||||||||||||
| 0 | 0 |
|
|
|
|
|
|
| IPAIR | NAME | SHIFT | NEWSHIFT | S/N | NAME | SHIFT | NEWSHIFT | S/N |
| 0 | 07530088 | 0.479712 | 0.00000 | 18.9476 | 07530087 | 0.00188216 | 0.477830 | 18.8339 |
| 1 | 07530089 | 0.479598 | 0.000114024 | 19.0091 | 07530090 | 0.00194168 | 0.477770 | 18.9354 |
| 2 | 07530085 | 0.478125 | 0.00158700 | 18.9304 | 07530086 | 0.00316577 | 0.476546 | 18.8020 |
| 3 | 07530084 | 0.478478 | 0.00123399 | 18.8341 | 07530083 | 0.00000 | 0.479712 | 18.7170 |